Equations to Plots
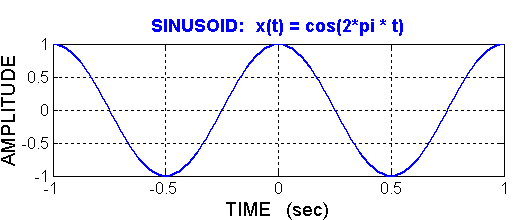
In order to plot \(x(t) = \cos(2 \pi t )\), we need to determine its height and its zero crossings. The maximum value of the cosine is one, so the positive and negative going peaks will be at +1 and -1. These occur when the argument of the cosine is 0, \(\pi\), \(2\pi\), etc. Along the time axis, the peaks will be at: \(t = -1, -1/2, 0, 1/2, 1, 3/2\), etc.The cosine function crosses zero when its argument is equal to \(\pi/2, 3\pi /2\), etc. (odd multiples of \(\pi/2\)). In the plot below, these are the times: \(t= -1/4, 1/4, 3/4, 5/4\), etc.
Now try some other cases:
Sketch a plot of \(x(t) = \cos(2 \pi 100 t)\). Answer
Sketch a plot of \(x(t) = 5 \cos(2 \pi 100 t)\). Answer
 DSP First 2e
McClellan, Schafer, Yoder
ISBN-10: 0136019250 • ISBN-13: 9780136019251
© 2016 Pearson Education, Inc.