Clay Whistle Demo
This demo illustrates that (nearly) sinusoidal signals
can be produced by other simple physical systems.
In this case, we use a simple clay whistle which
can be modeled as a an "acoustic tube" or a closed-end pipe.
The objective of the demo is to listen to the sounds of two different clay whistles and then compute the frequencies of the sinusoids from a plot.
BLUE-BIRD WHISTLE: Here is a plot of part of the sound from the blue-bird clay whistle.
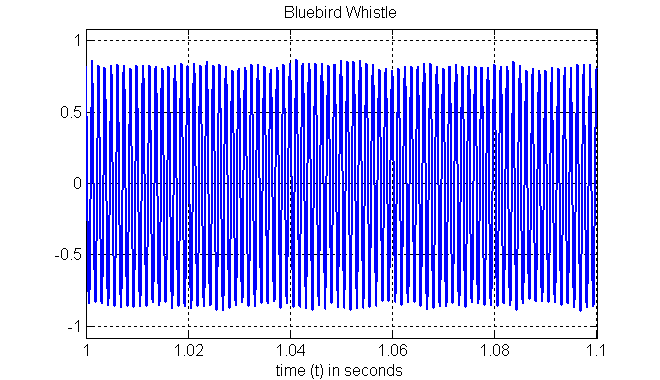
Click plot to play the sound from the blue-bird clay whistle
Notice that the maximum is nearly constant.
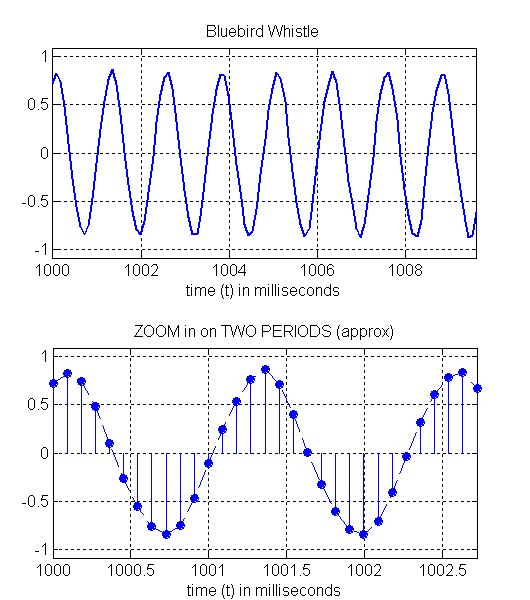
What is the frequency of the blue-bird whistle?
You can compute it by measuring the period from the zoomed plots below.
The second plot shows the individal signal samples stored in the computer.
ANSWER for the frequency
CAT WHISTLE: Here is a plot of part of the sound from the cat clay whistle.
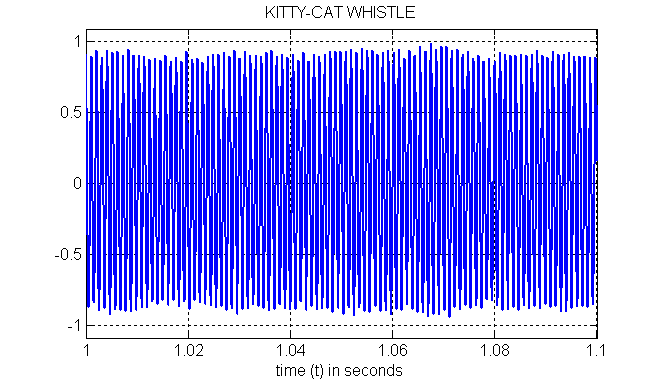
Click plot to play the sound from the cat clay whistle
Notice that the maximum is nearly constant in this (relatively long) time interval.
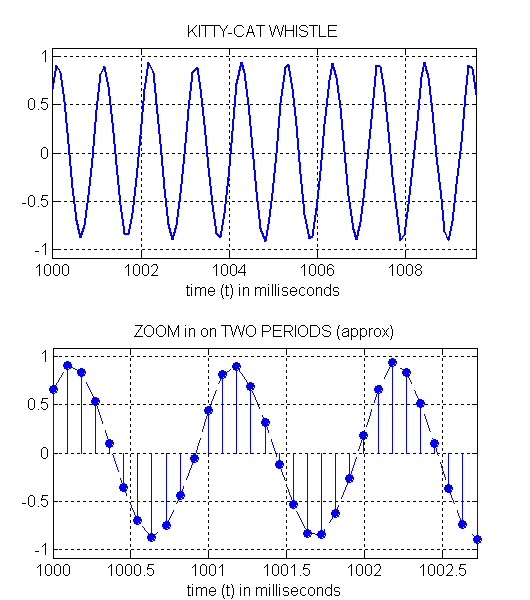
What is the frequency of the cat whistle?
As before, you can compute it by measuring the period from the zoomed plots below.
ANSWER for the frequency
In case you are interested: Here is the MATLAB (version 5) code that generated the plots for the blue-bird whistle:
The objective of the demo is to listen to the sounds of two different clay whistles and then compute the frequencies of the sinusoids from a plot.
|
CLAY WHISTLE: BLUE-BIRD
This clay whistle emits a nearly sinusoidal signal when you blow it. Can you determine the frequency of the sinusoidal signal that is produced by the whistle? |
SOUND |
|
CLAY WHISTLE: CAT
This clay whistle also emits a nearly sinusoidal signal when you blow it. The frequency should sound higher. Once again, you should determine the frequency of the sinusoid (see the plots below). |
SOUND |
BLUE-BIRD WHISTLE: Here is a plot of part of the sound from the blue-bird clay whistle.
Click plot to play the sound from the blue-bird clay whistle
Notice that the maximum is nearly constant.
What is the frequency of the blue-bird whistle?
You can compute it by measuring the period from the zoomed plots below.
The second plot shows the individal signal samples stored in the computer.
ANSWER for the frequency
CAT WHISTLE: Here is a plot of part of the sound from the cat clay whistle.
Click plot to play the sound from the cat clay whistle
Notice that the maximum is nearly constant in this (relatively long) time interval.
What is the frequency of the cat whistle?
As before, you can compute it by measuring the period from the zoomed plots below.
ANSWER for the frequency
In case you are interested: Here is the MATLAB (version 5) code that generated the plots for the blue-bird whistle:
%---
%--- display the Bluebird Whistle Waveform
%---
[xx,Fs,nbits] = wavread('bluebird.wav');
xmax = max(abs(xx));
%
blowup = 1;  %- 0=FALSE, 1=TRUE
if blowup
   font_size = 24; line_width = 4; dot_size = 40; axis_font = 18;
else
   font_size = 14; line_width = 2; dot_size = 20; axis_font = 14;
end
Fs   %- echo the value of Fs, it should be 11025
Freq = 800;   %- This is approximate
figure(1), clf reset
jkl = 11025 + (1:1104);
tt = (jkl-1)/(Fs);
subplot('Position',[0.1 0.57 0.8 0.35])
hp = plot(tt,xx(jkl)),grid on
set(hp,'LineWidth',line_width)
title('BLUEBIRD WHISTLE','FontSize',font_size)
xlabel('time (t) in seconds','FontSize',font_size)
axis([tt(1),tt(length(tt)),1.1*xmax*[-1,1] ])
set(gca,'FontSize',axis_font)
%
figure(2), clf reset
jkl = 11025 + (0:round(7.7*Fs/Freq));
tt = 1000*jkl/Fs;
subplot('Position',[0.1 0.57 0.8 0.35])
hp = plot(tt,xx(jkl)),grid on
set(hp,'LineWidth',line_width)
title('BLUEBIRD WHISTLE','FontSize',font_size)
xlabel('time (t) in milliseconds','FontSize',font_size)
axis([tt(1),tt(length(tt)),1.1*xmax*[-1,1] ])
set(gca,'FontSize',axis_font)
%
jkl = 11025 + (0:round(2.2*Fs/Freq));
tt = 1000*jkl/Fs;
subplot('Position',[0.1 0.07 0.8 0.35])
stemdot(tt,xx(jkl),dot_size,line_width)
hold on, plot(tt,xx(jkl),'--'), grid on, hold off
title('ZOOM in on TWO PERIODS (approx)','FontSize',font_size)
xlabel('time (t) in milliseconds','FontSize',font_size)
axis([tt(1),tt(length(tt)),1.1*xmax*[-1,1] ])
set(gca,'FontSize',axis_font)
 DSP First 2e
McClellan, Schafer, Yoder
ISBN-10: 0136019250 • ISBN-13: 9780136019251
© 2016 Pearson Education, Inc.