Simple Sinusoids
Did you notice that they all had the same pitch, but they sounded different. Why is it?
Let's look at each in the time domain (i.e. plotted vs. time.)
Plot Sounds in Time Domain
Listen to each of the signals again by clicking on the waveform.
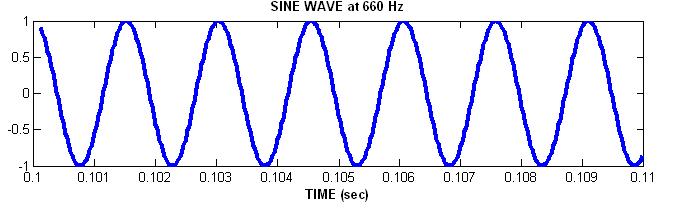
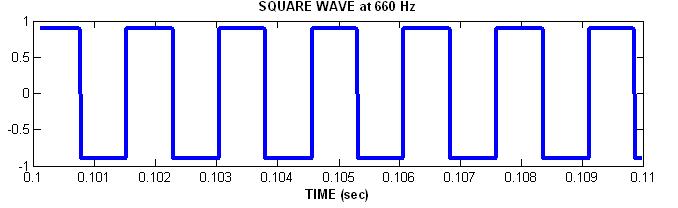
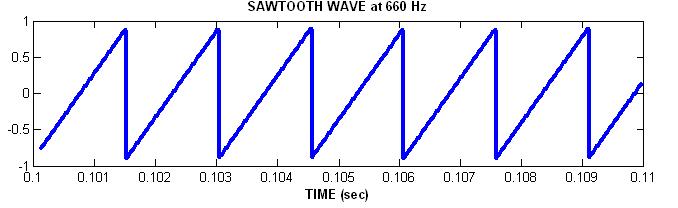
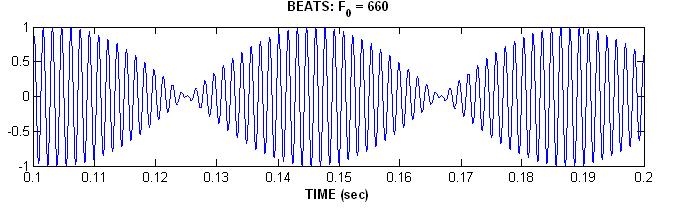
Do you hear a connection between the sound and the wave? (I don't)
Maybe the time-domain waveform isn't the best way to get such a connection.
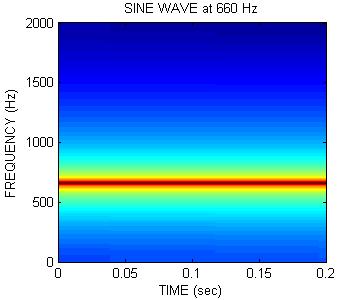
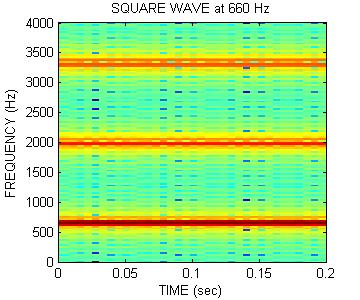
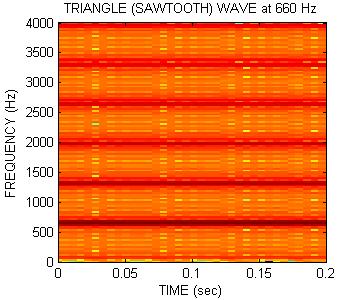
Plot Sounds in Frequency Domain
Another way to view the sounds is in the frequency domain. This is done by breaking the signal into many parts and computing the spectrum of each part. The spectra are plotted with a dark component representing a strong spectral component and white meaning no energy.Listen to each of the signals again by clicking on the waveform.
Do you hear a connection between the sound and the wave? (I don't)
Maybe the time domain waveform isn't that best way to get such a connection.
Plot Noise vs. time and frequency
Even complicated sounds such as the following can be represented in the frequency domain:This sound is noisy and harsh to the ear. It turns out that this signal contains all frequencies with equal power and is, therefore called "white noise."
You can listen to the signal again by clicking on plots.
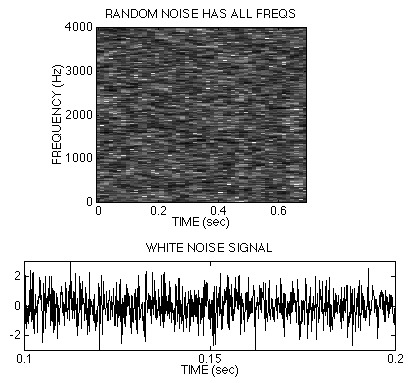
Does the spectrogram show any dominant frequency?
(No, it appears to have more or less the same gray color throughout.)
It can be synthesized in MATLAB with the randn(m,n) function.
 DSP First 2e
McClellan, Schafer, Yoder
ISBN-10: 0136019250 • ISBN-13: 9780136019251
© 2016 Pearson Education, Inc.