Chirp Synthesis Demo
A linear-FM (chirp) signal is an ideal test signal to explore the concept of aliasing due to sampling.
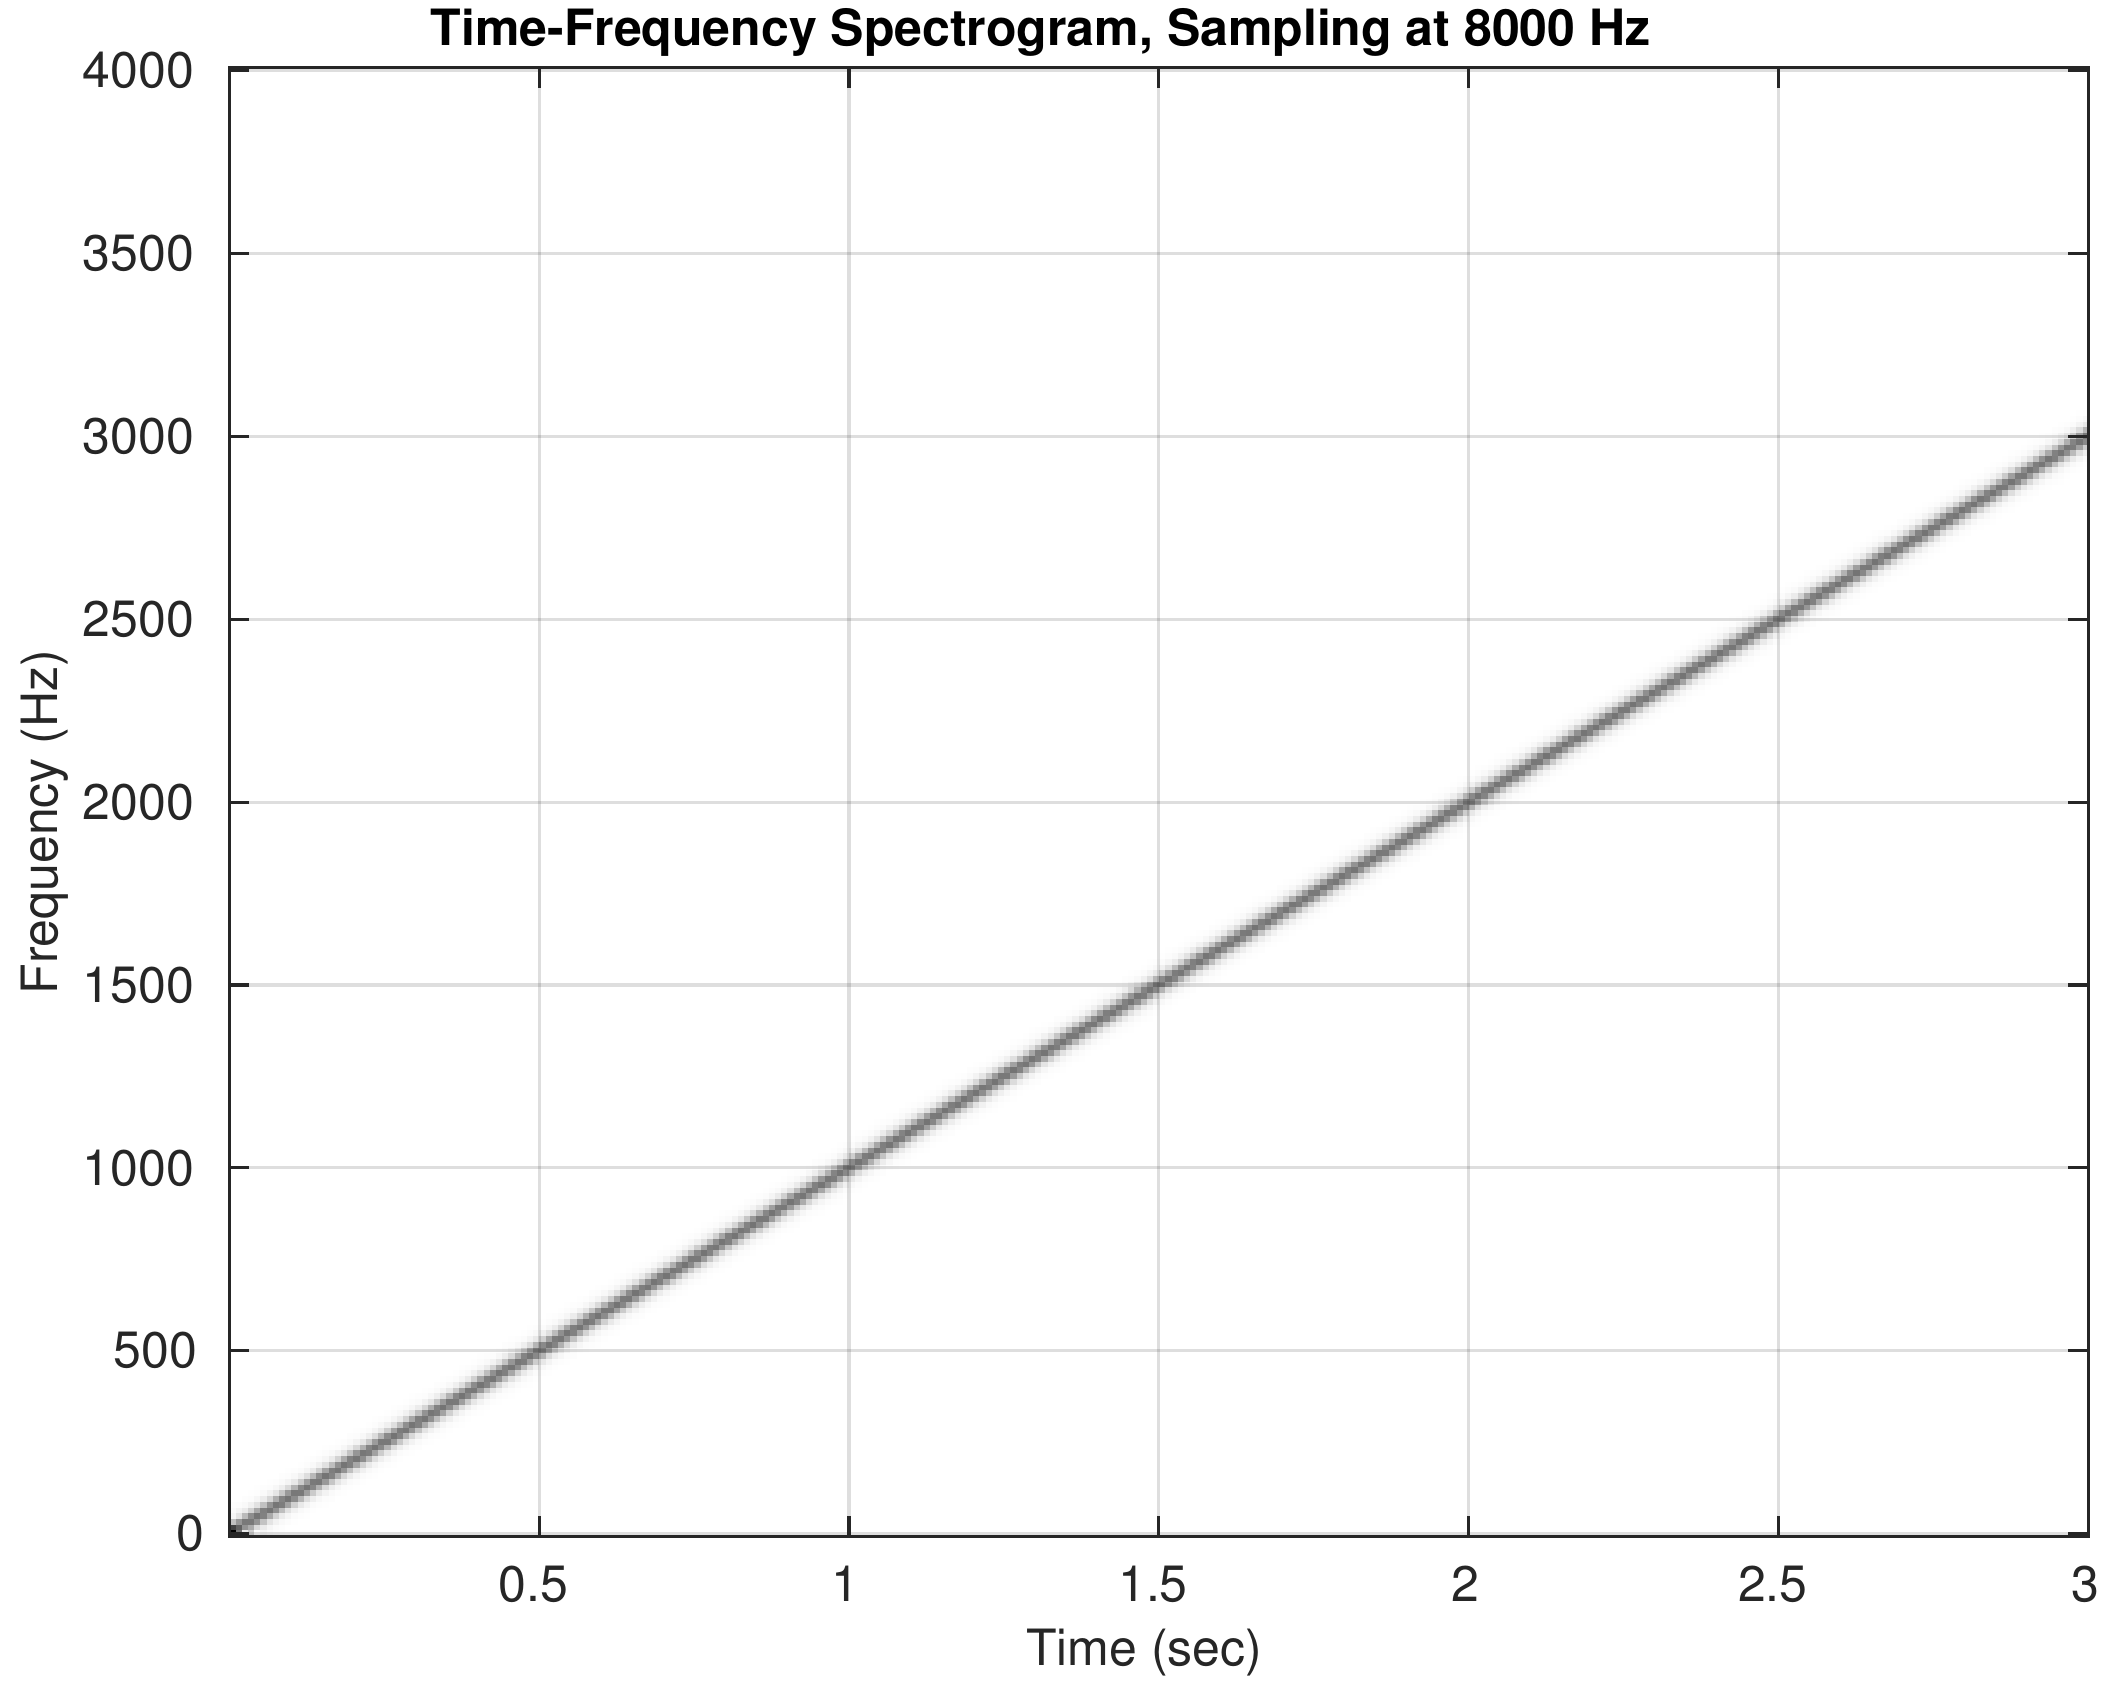
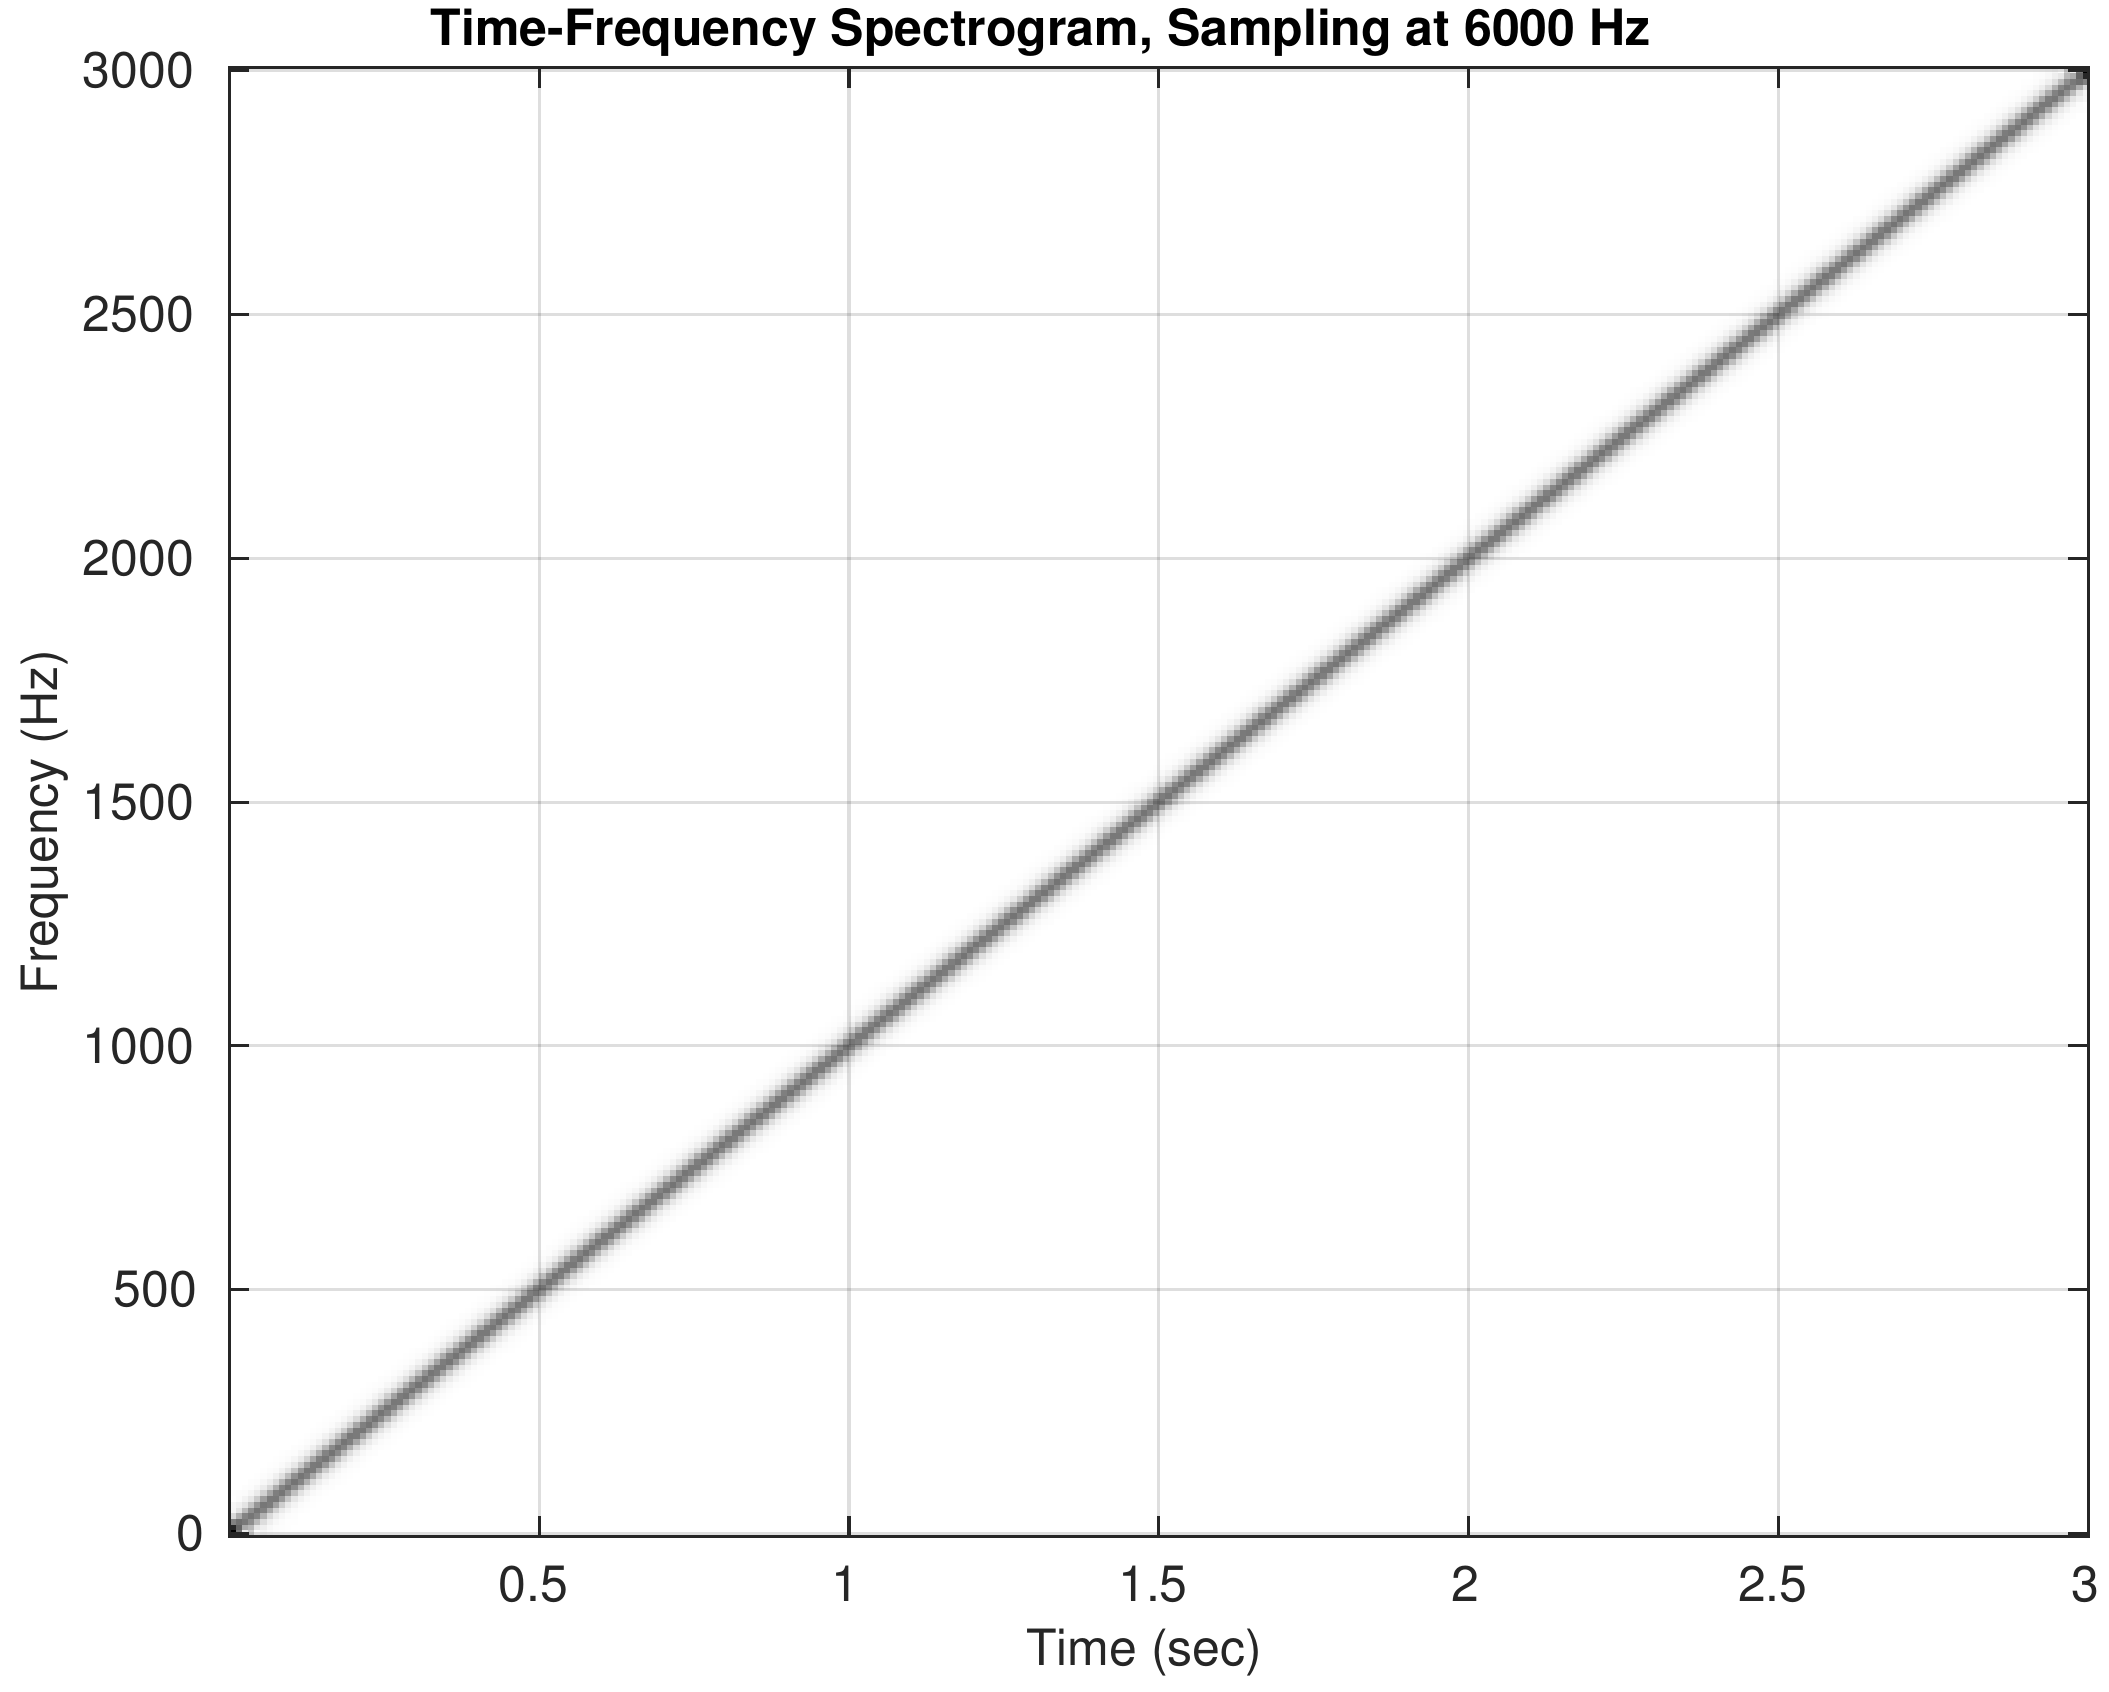
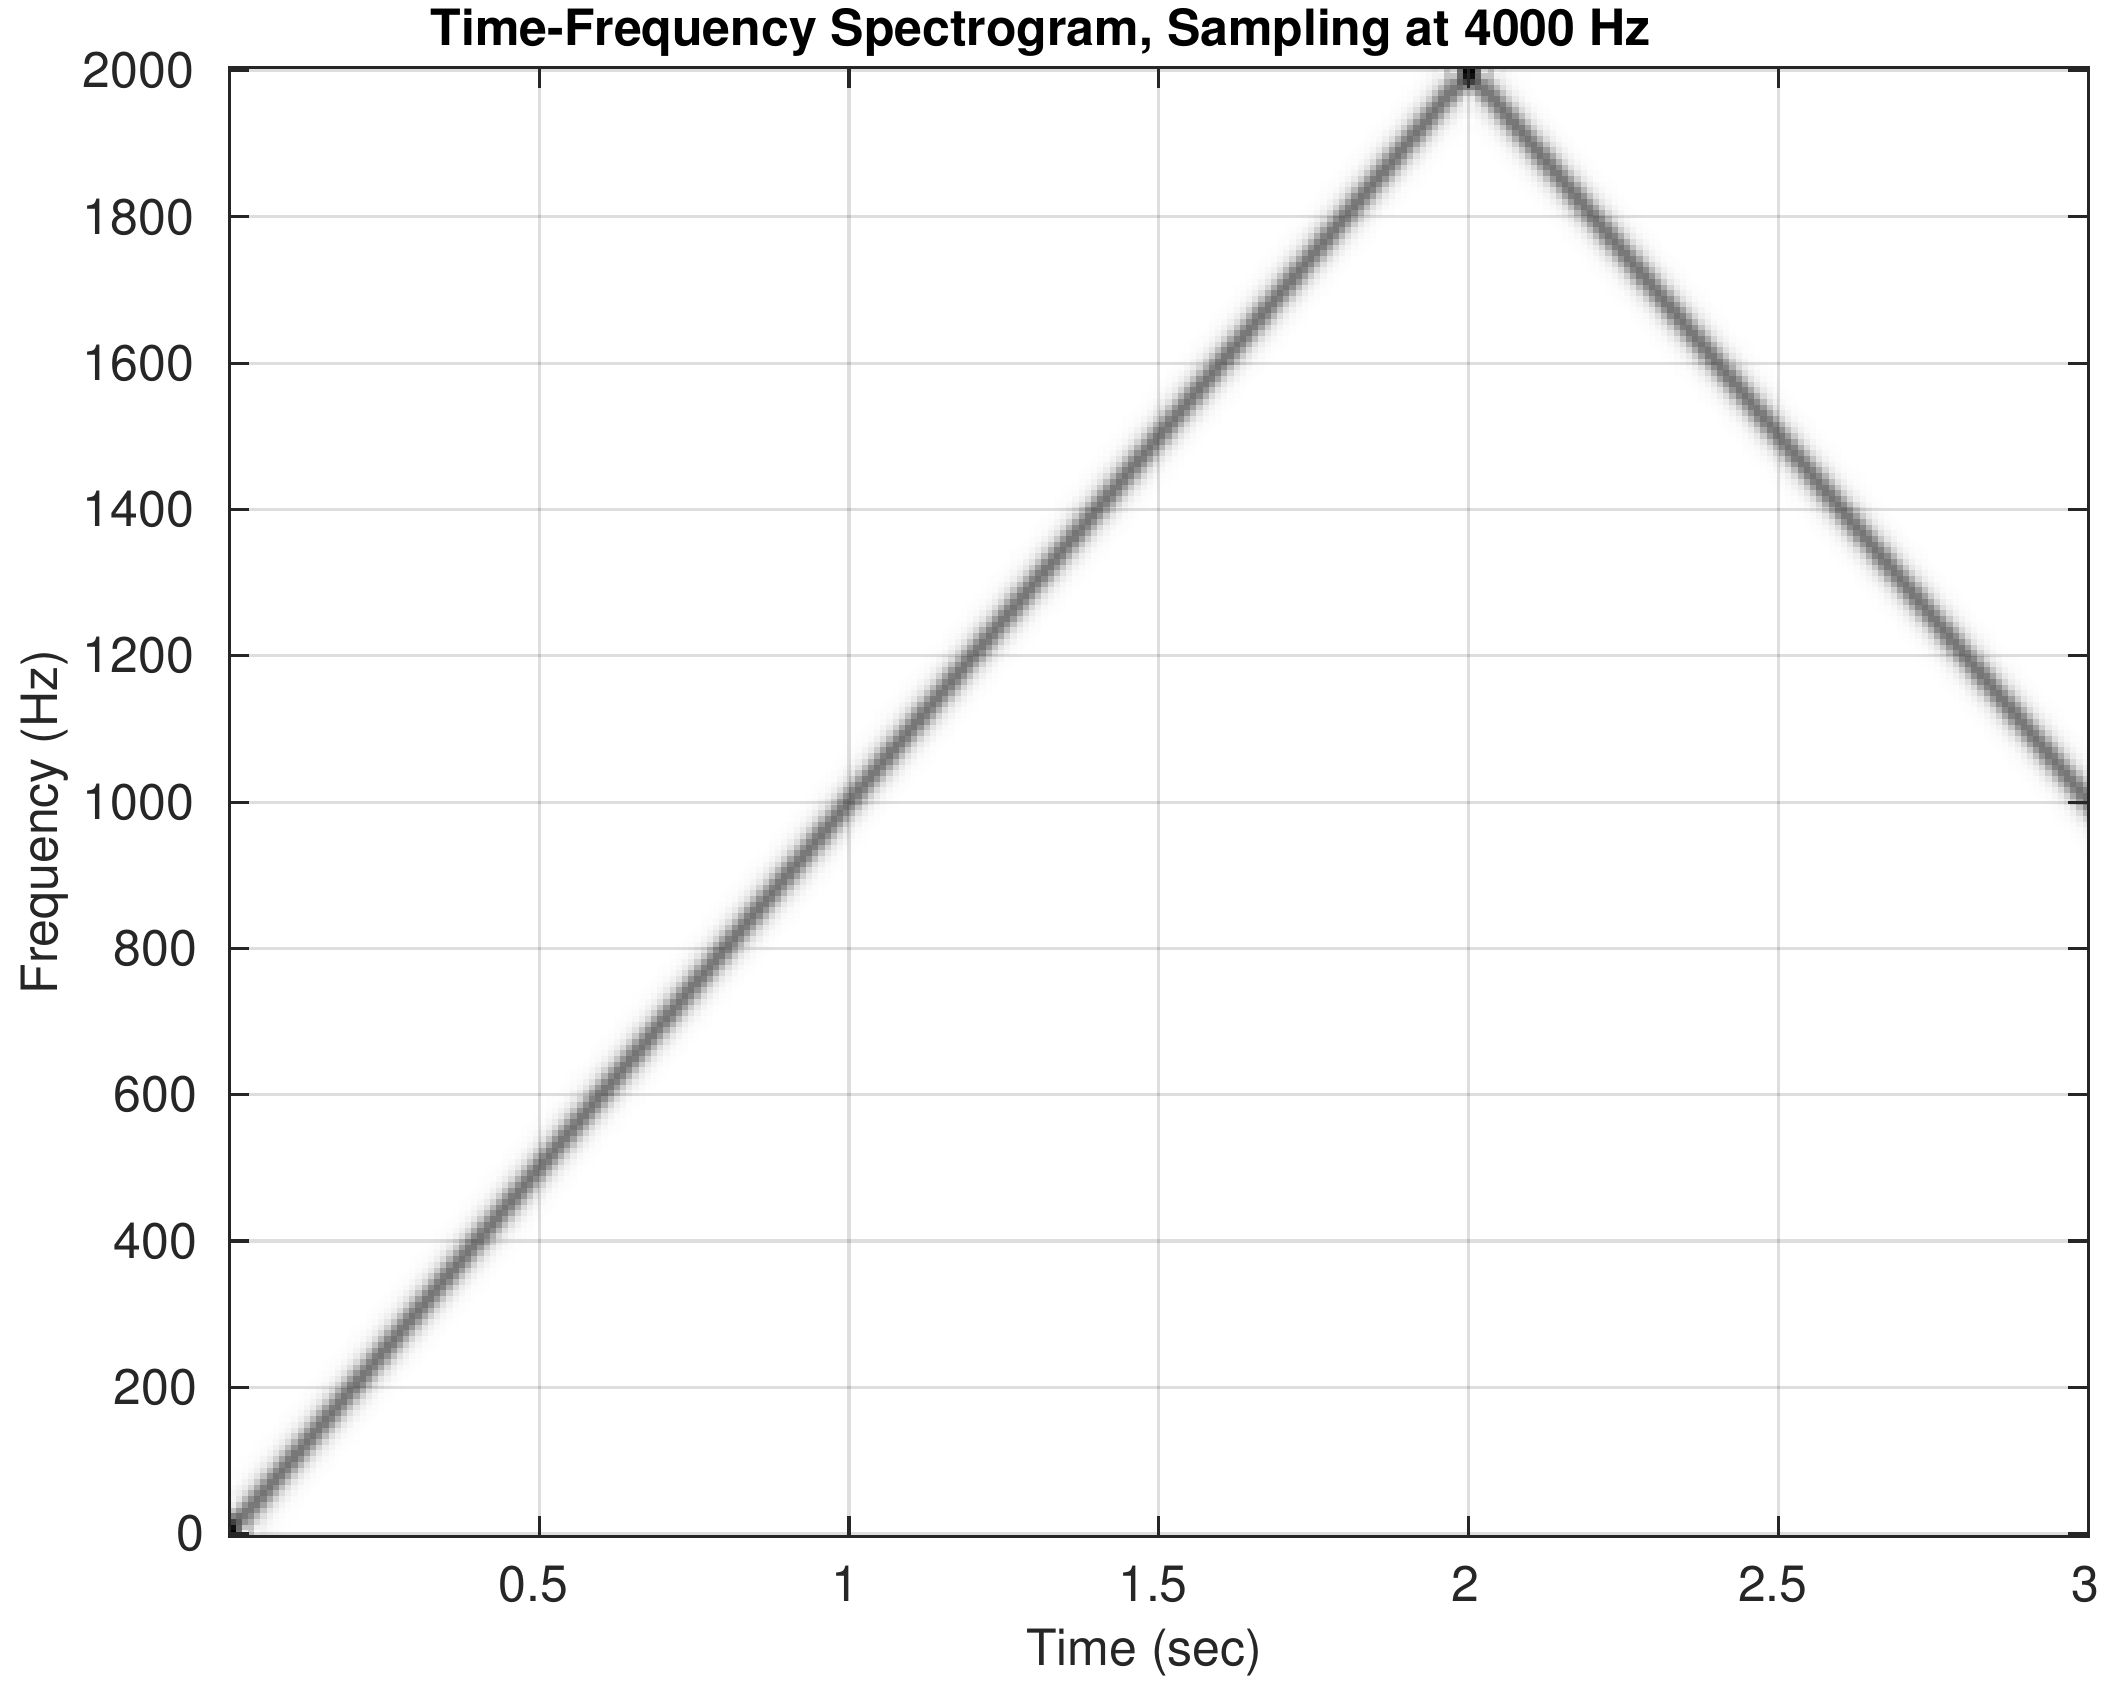
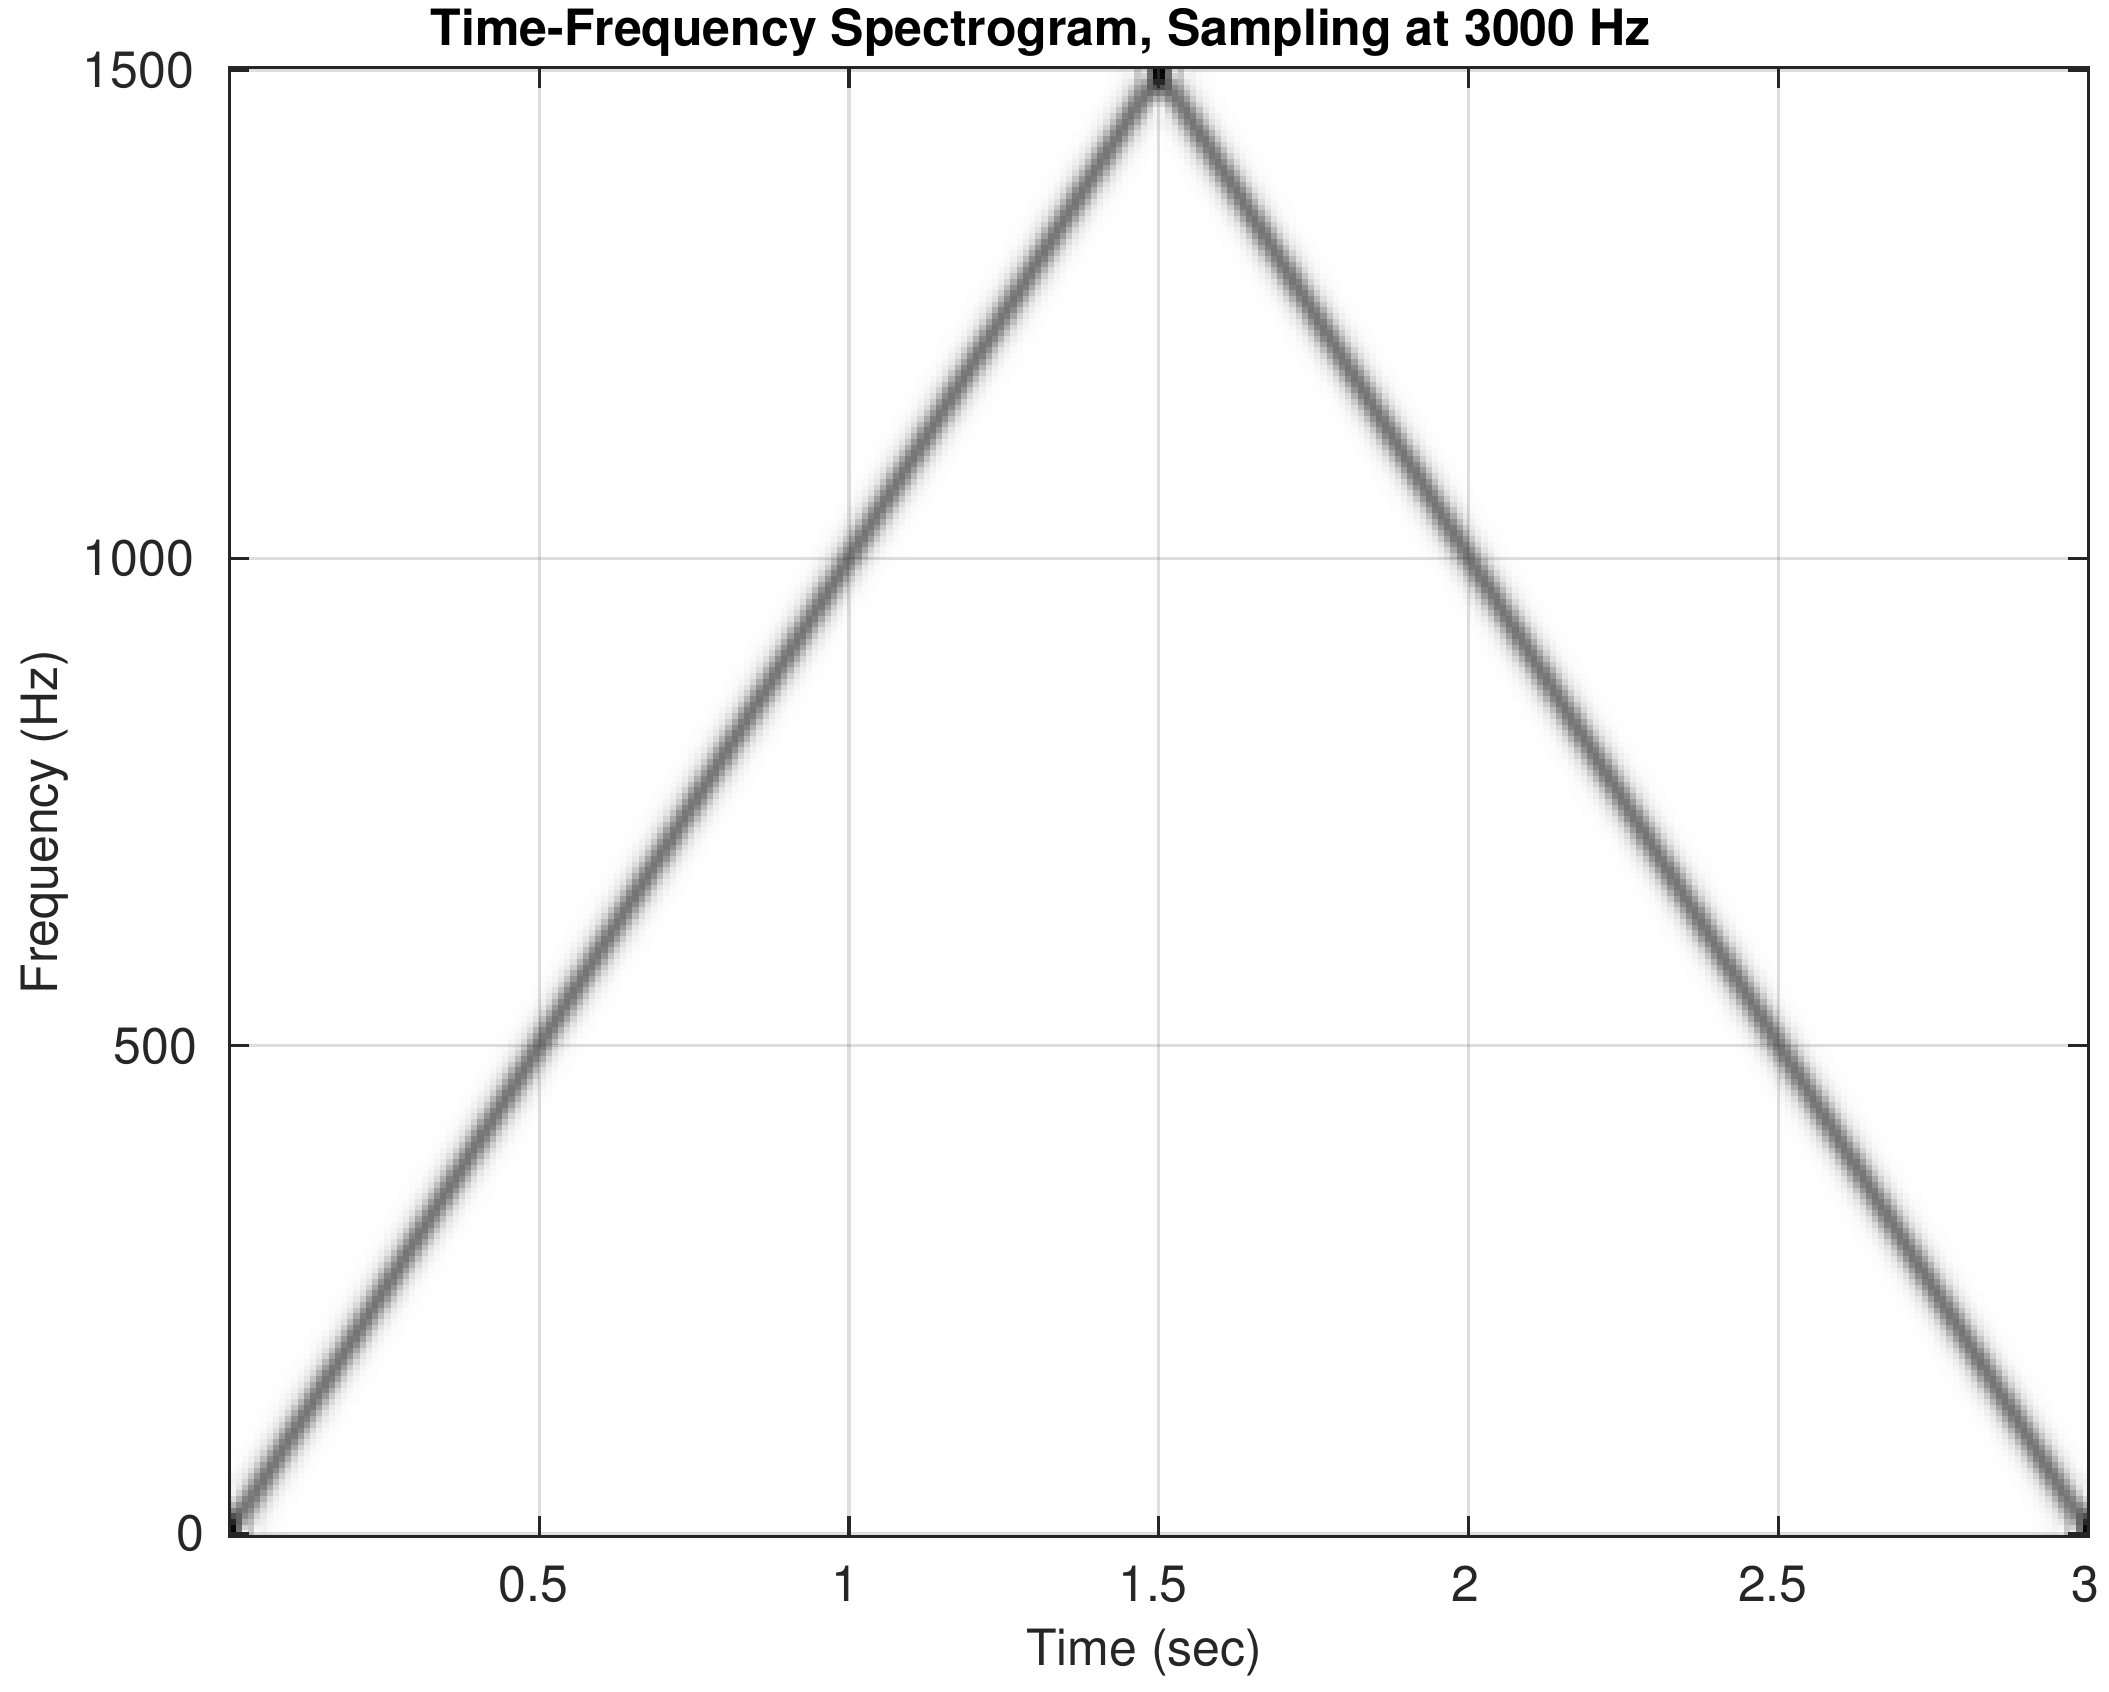
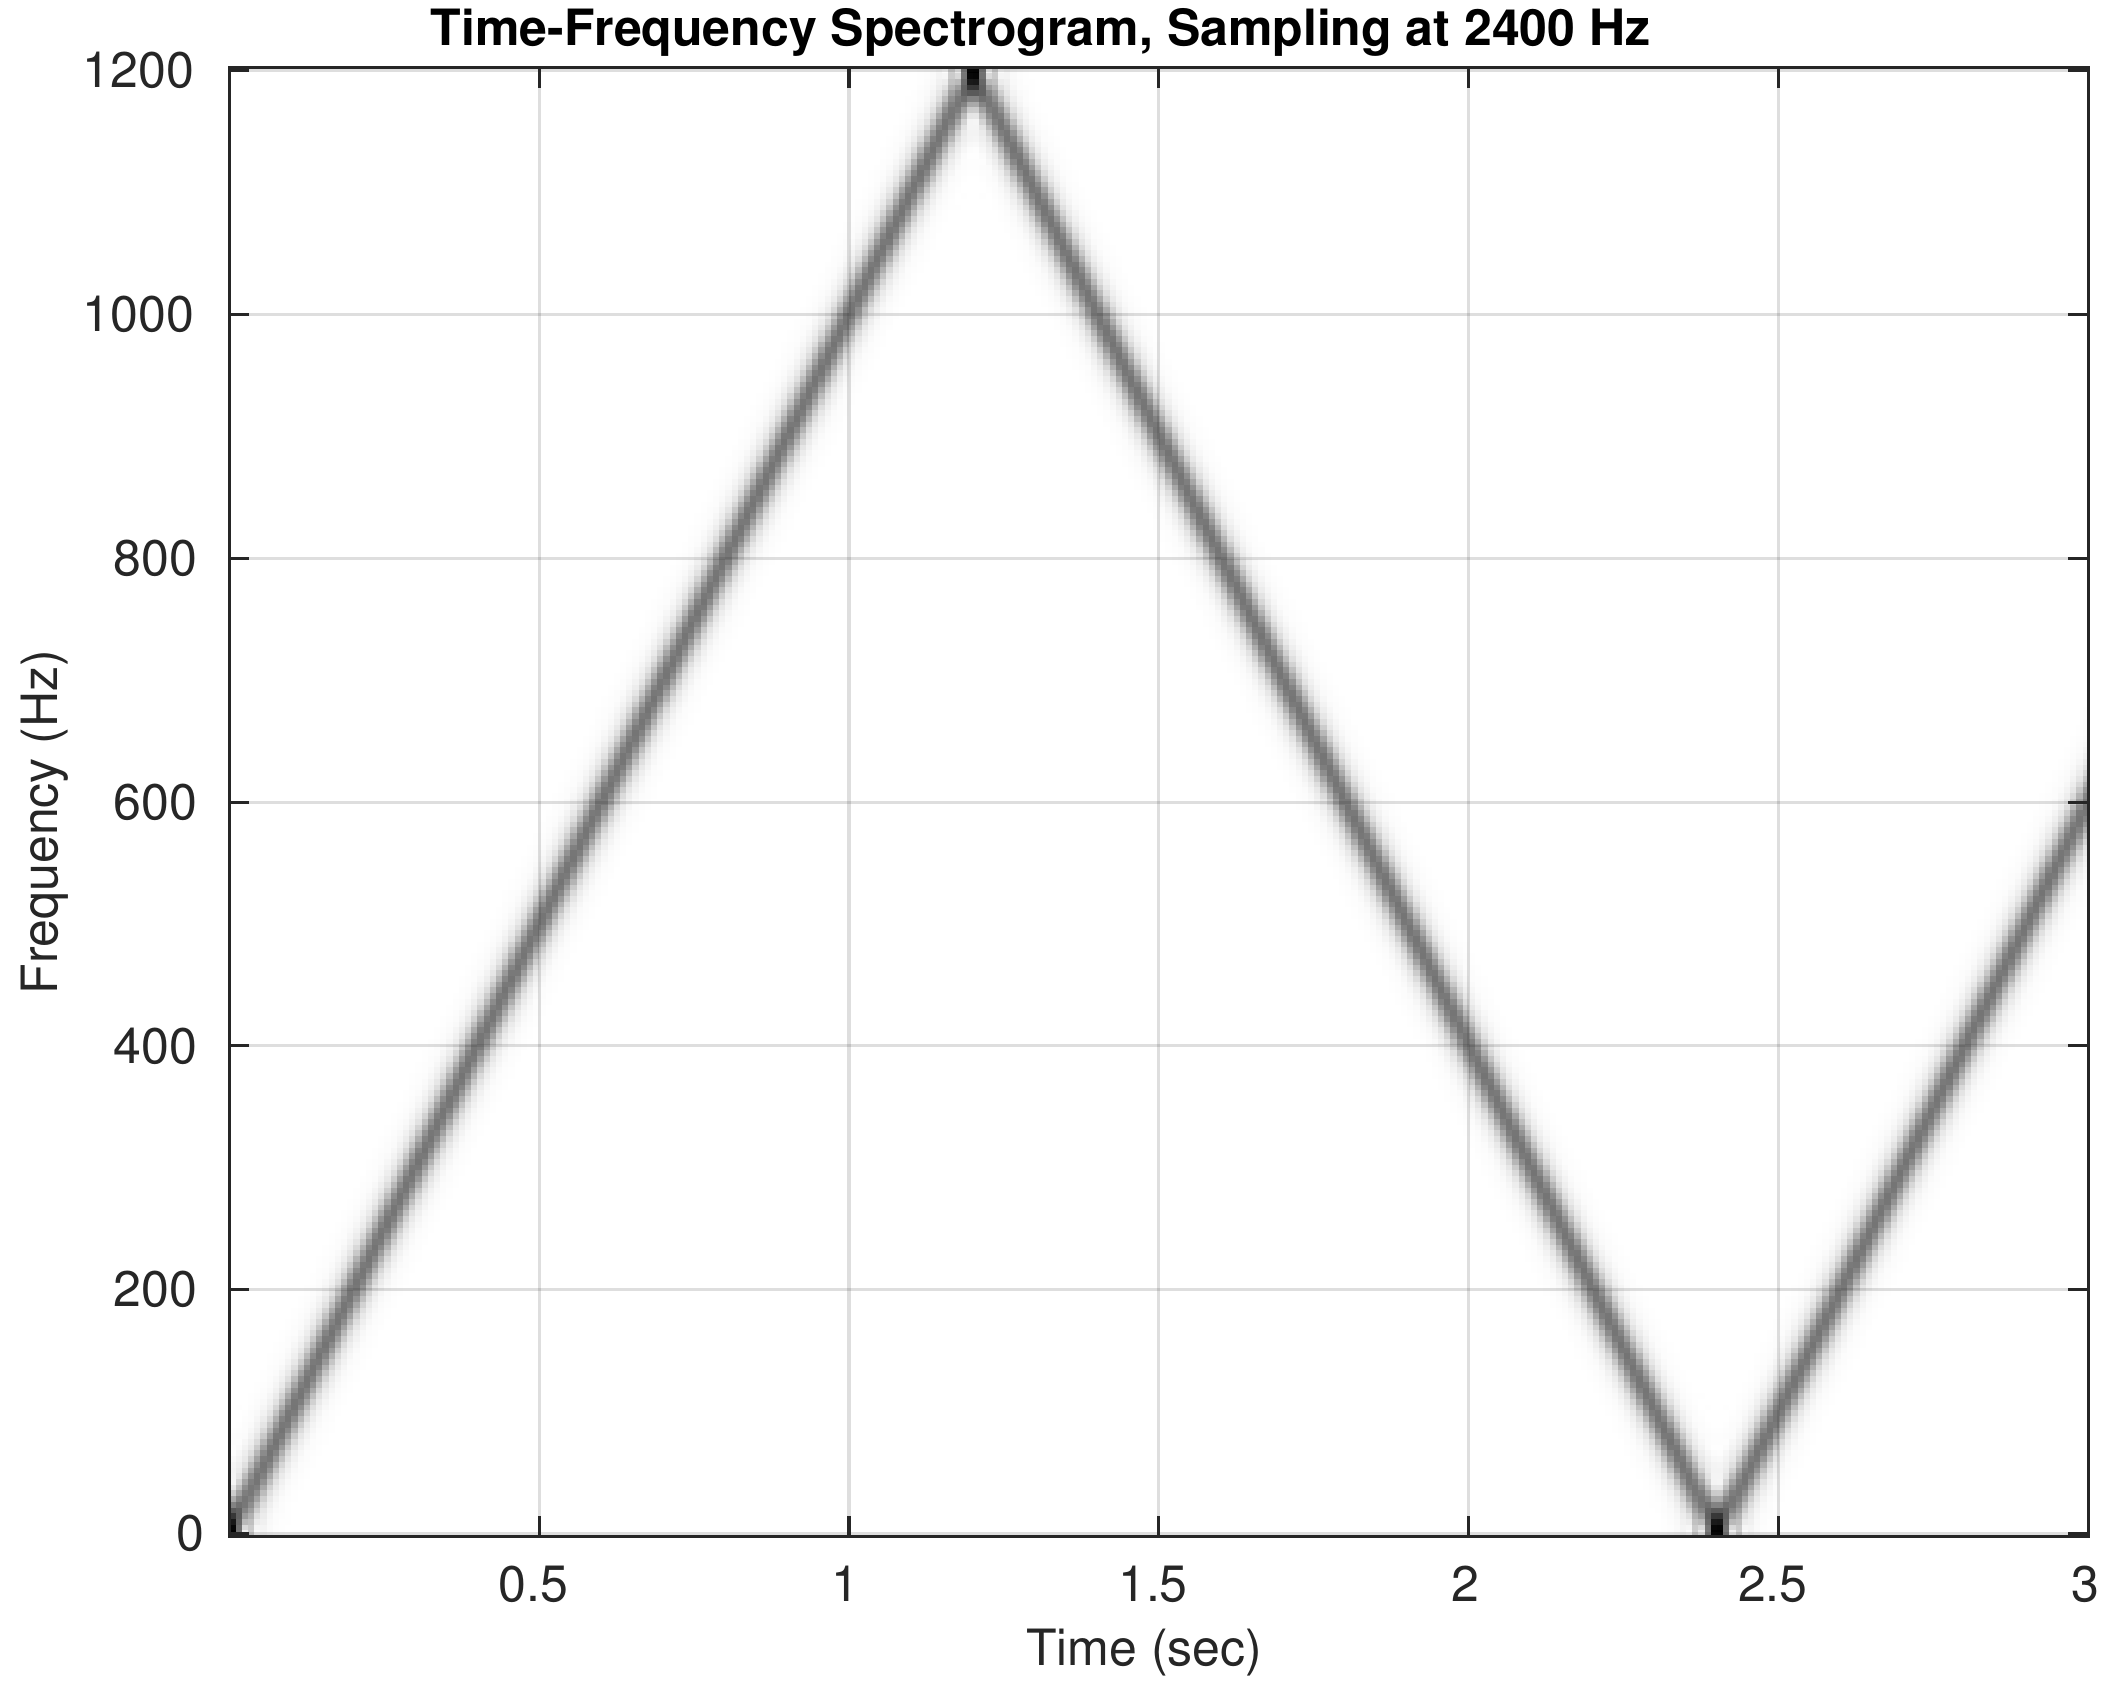
By visualizing the spectrogram of a synthesized chirp and listening to the sound, we experience the fact that a D-to-C converter cannot create output signals with frequencies higher than one half of the sampling frequency.
Consult Section 4-2.5 Maximum Reconstructed Frequency for more discussion of this issue.
This chirp synthesis demo consists of two simple components (a C-to-D converter and a D-to-C converter) and four steps:
- Use the mathematical formula for a continuous-time chirp signal $$ x(t) = \cos( \pi\alpha t^2 )\qquad 0\leq t \leq T $$ to define a signal whose chirp rate is \(\alpha\)Hz/s, whose duration is \(T\) seconds.
- Produce a discrete-time signal by sampling \(x(t)\) at a rate \(f_s\) samples/s. This is done by evaluating \(x(t)\) at \(t=n/f_s\), and is, in effect, a C-to-D converter. The result is \(x[n] = x(n/f_s)\).
-
Use Matlab's
soundscfunction to play the signal for listening. This is the D-to-C conversion component because a continuous-time signal must be created from \(x[n]\) in order to drive the audio output, i.e., the speakers. - Evaluate and display the spectrogram of \(x[n]\), which gives a visualization of what we hear.
Spectrograms for the five cases are shown below. Click on the spectrogram to hear the corresponding chirp. Note the different \(y\)-axis scales for frequency. When you listen to the sounds, try to follow the ups and downs that match the spectrograms.
 DSP First 2e
McClellan, Schafer, Yoder
ISBN-10: 0136019250 • ISBN-13: 9780136019251
© 2016 Pearson Education, Inc.