Input |
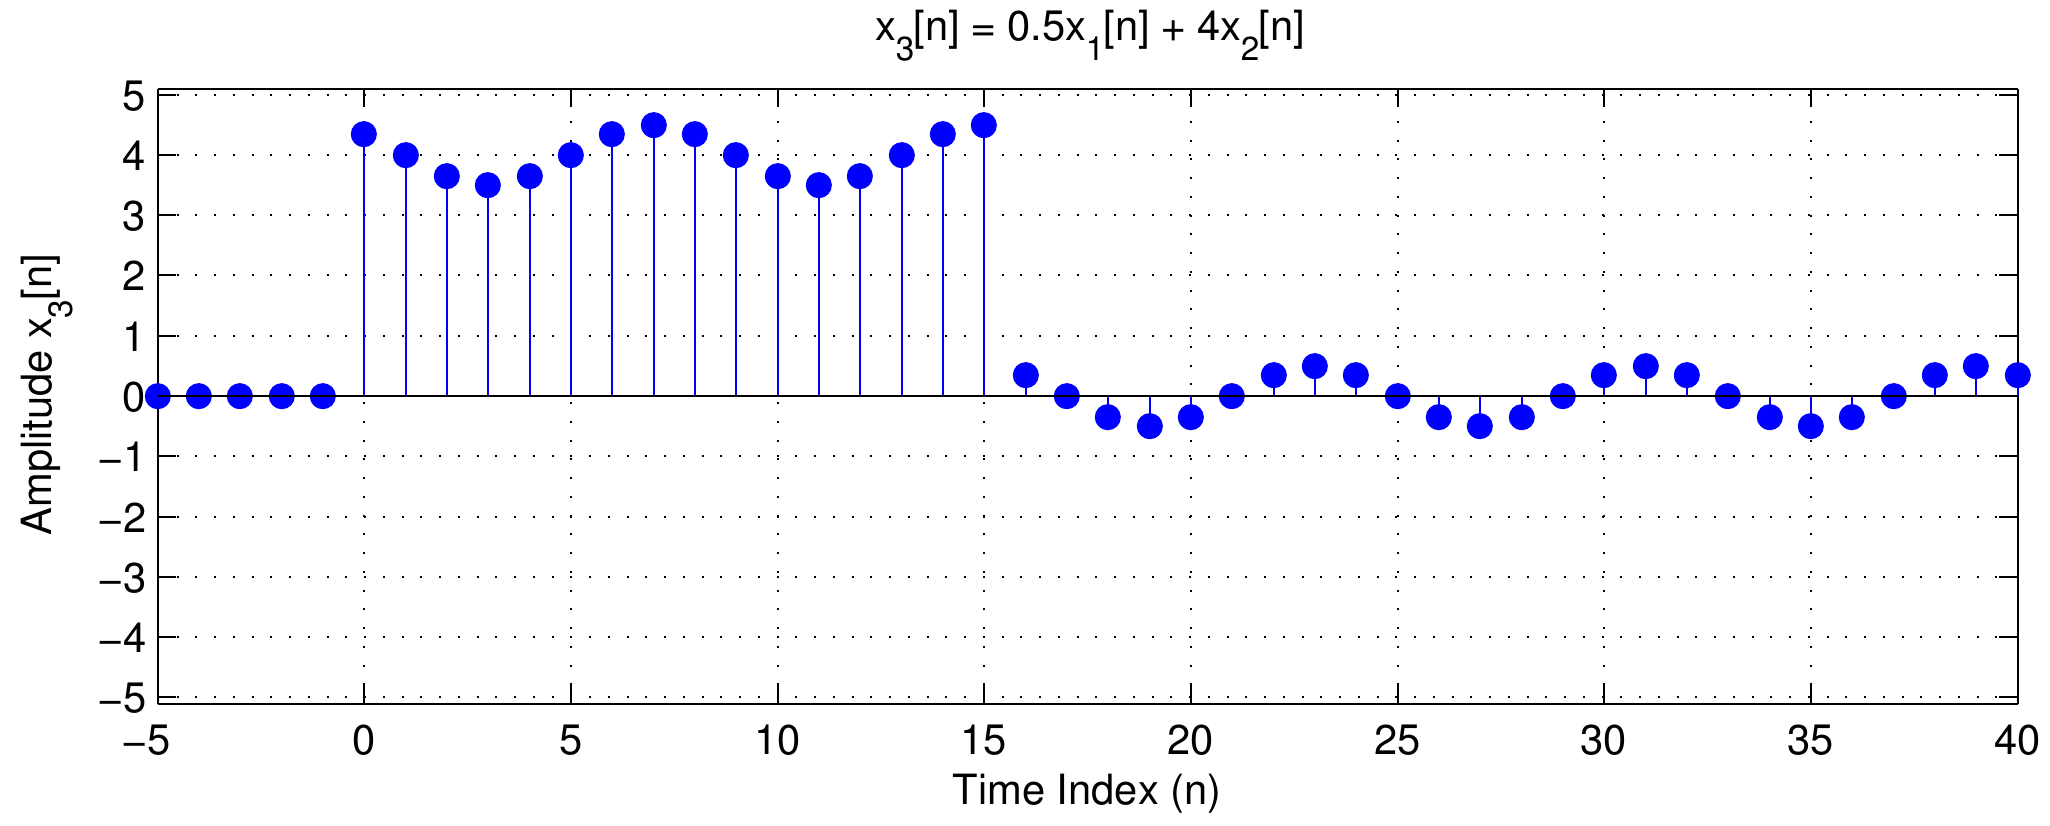
|
Output |
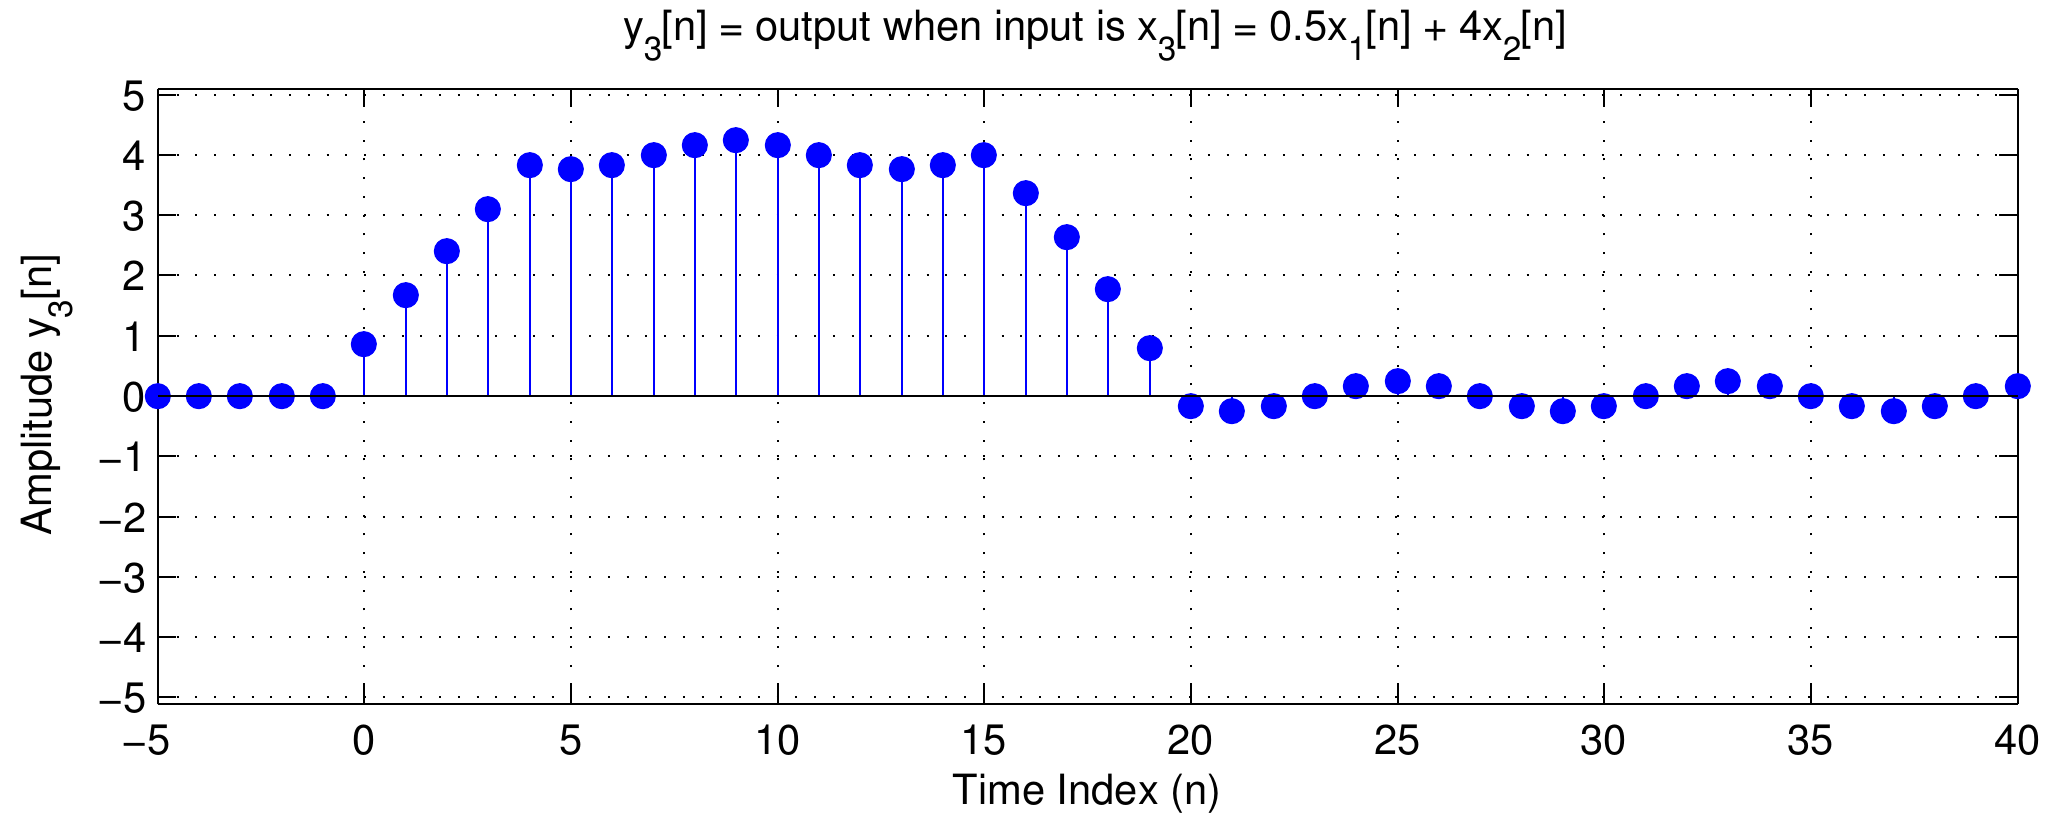
|
| Figure 1: Comparison of input and output waveforms for the five point averager filter. |
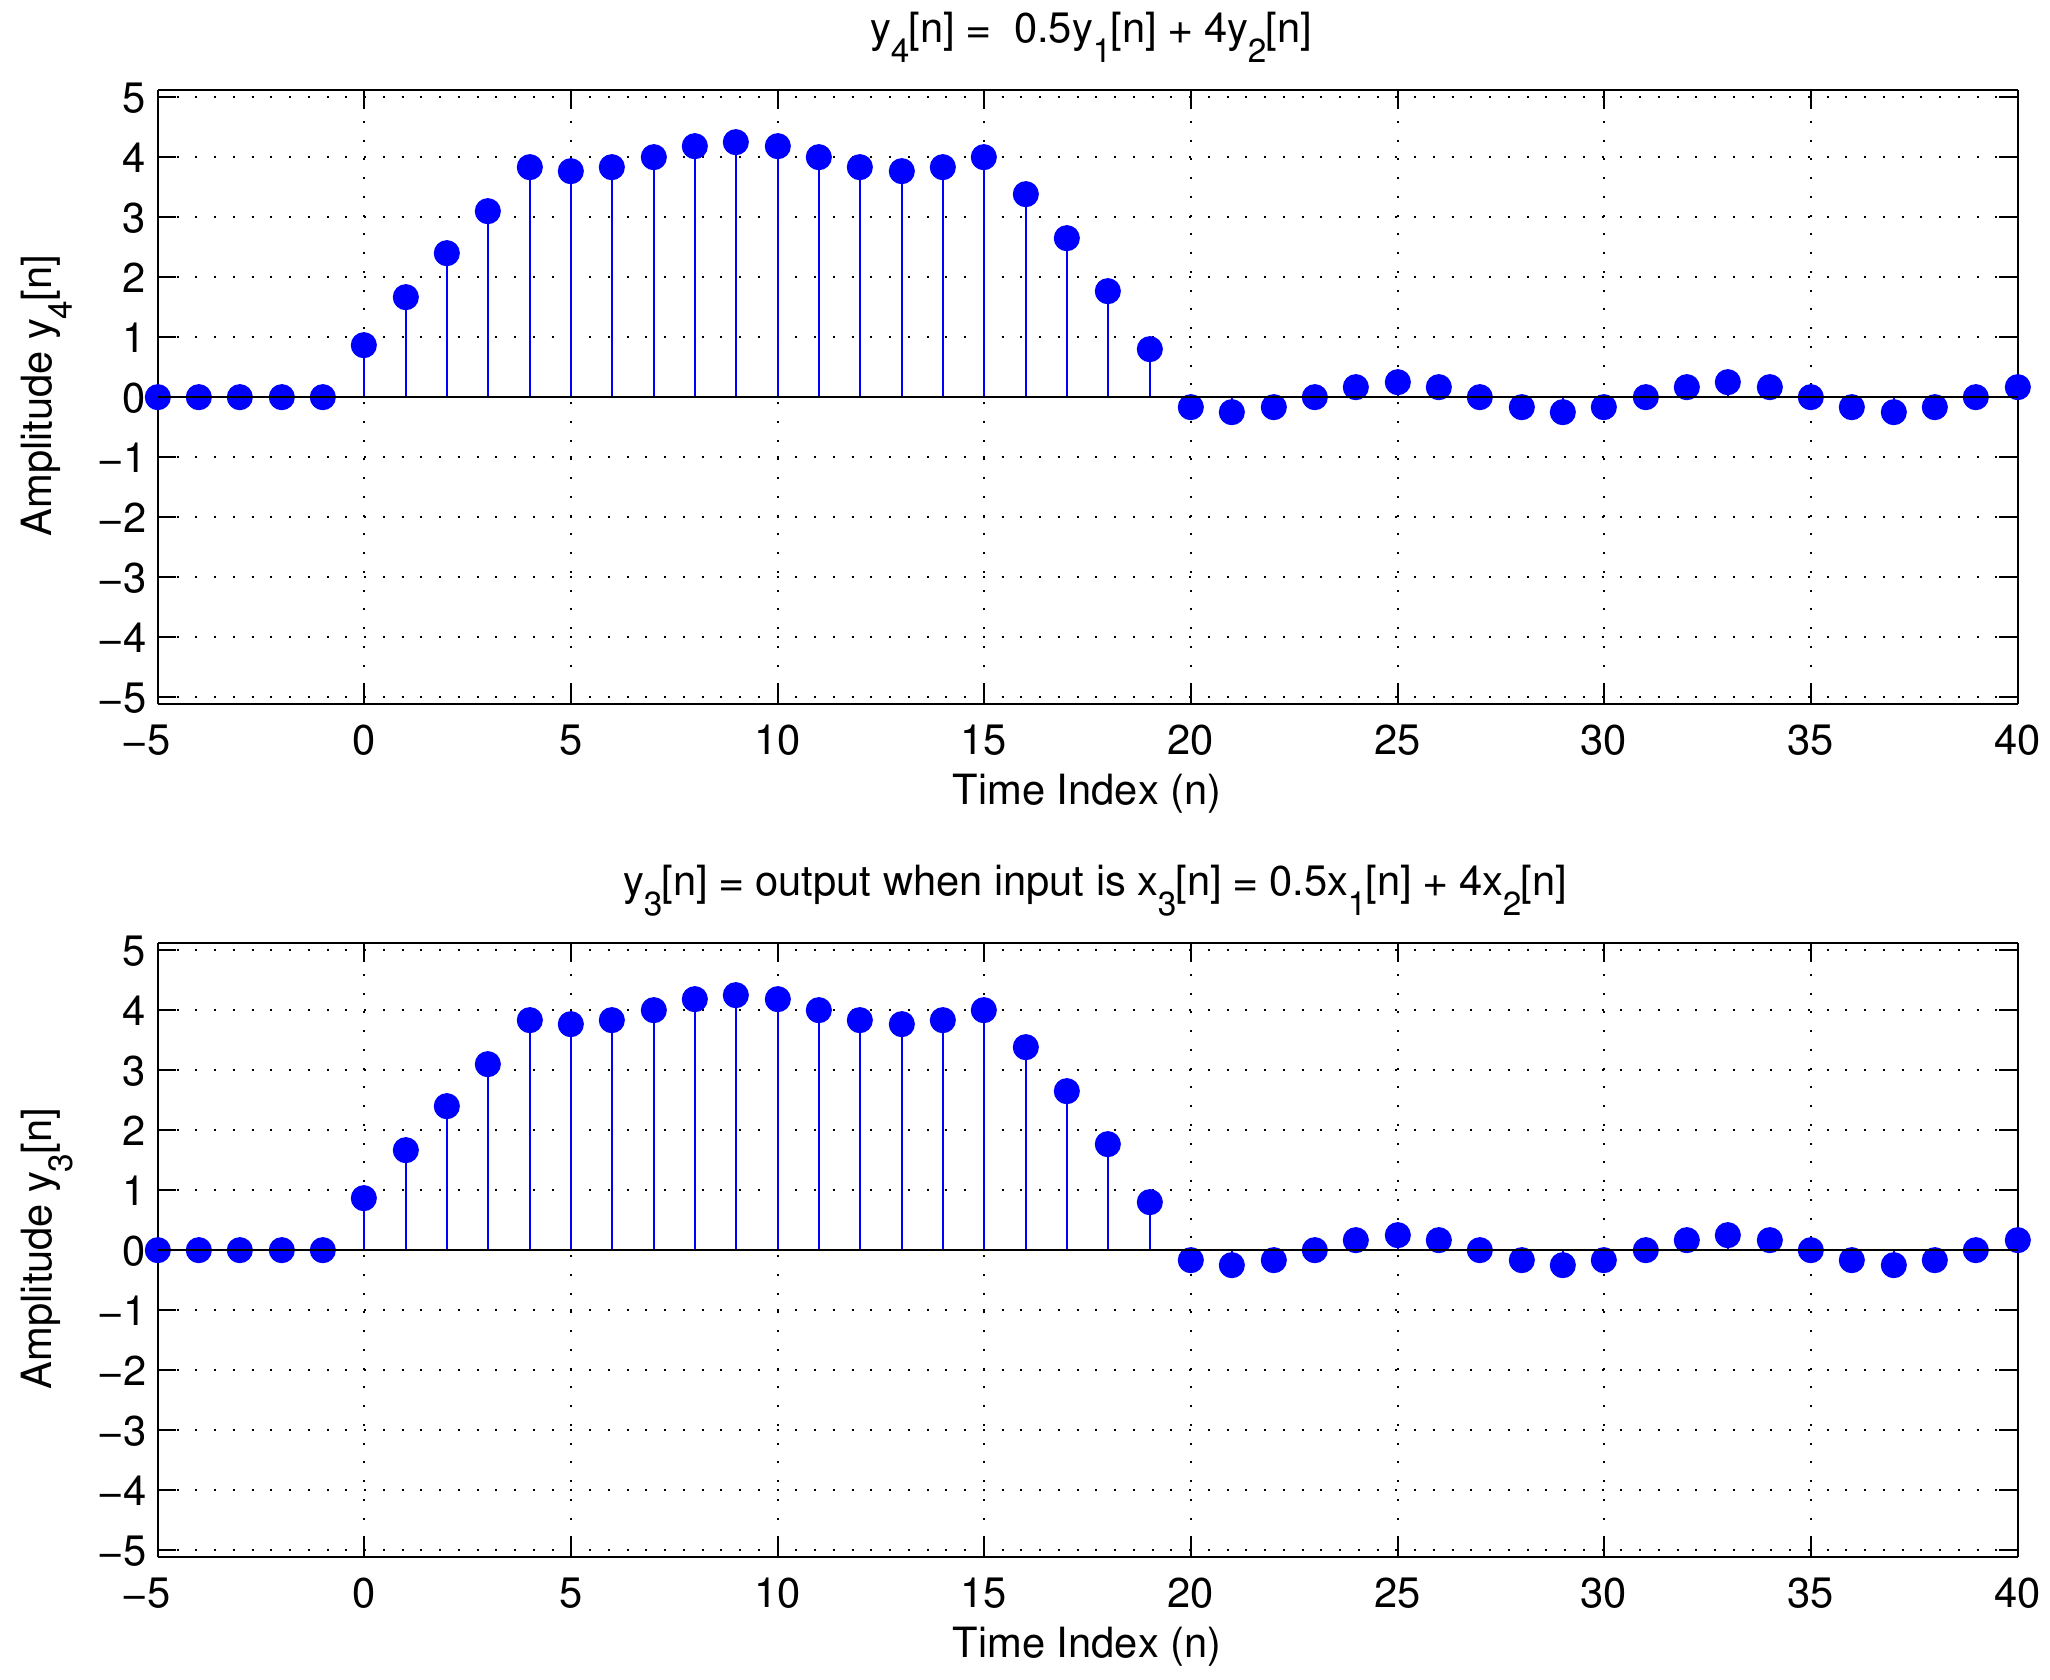
|
| Figure 2: The top panel is the sum of the filter outputs for input waveform number one and input waveform number two. The bottom panel is the output waveform from the five point averager filter for the scaled sum of the two input waveforms. Note that the waveforms are identical thus illustrating the linearity of the five point averager filter. |
 DSP First 2e
McClellan, Schafer, Yoder
ISBN-10: 0136019250 • ISBN-13: 9780136019251
© 2016 Pearson Education, Inc.