|
|
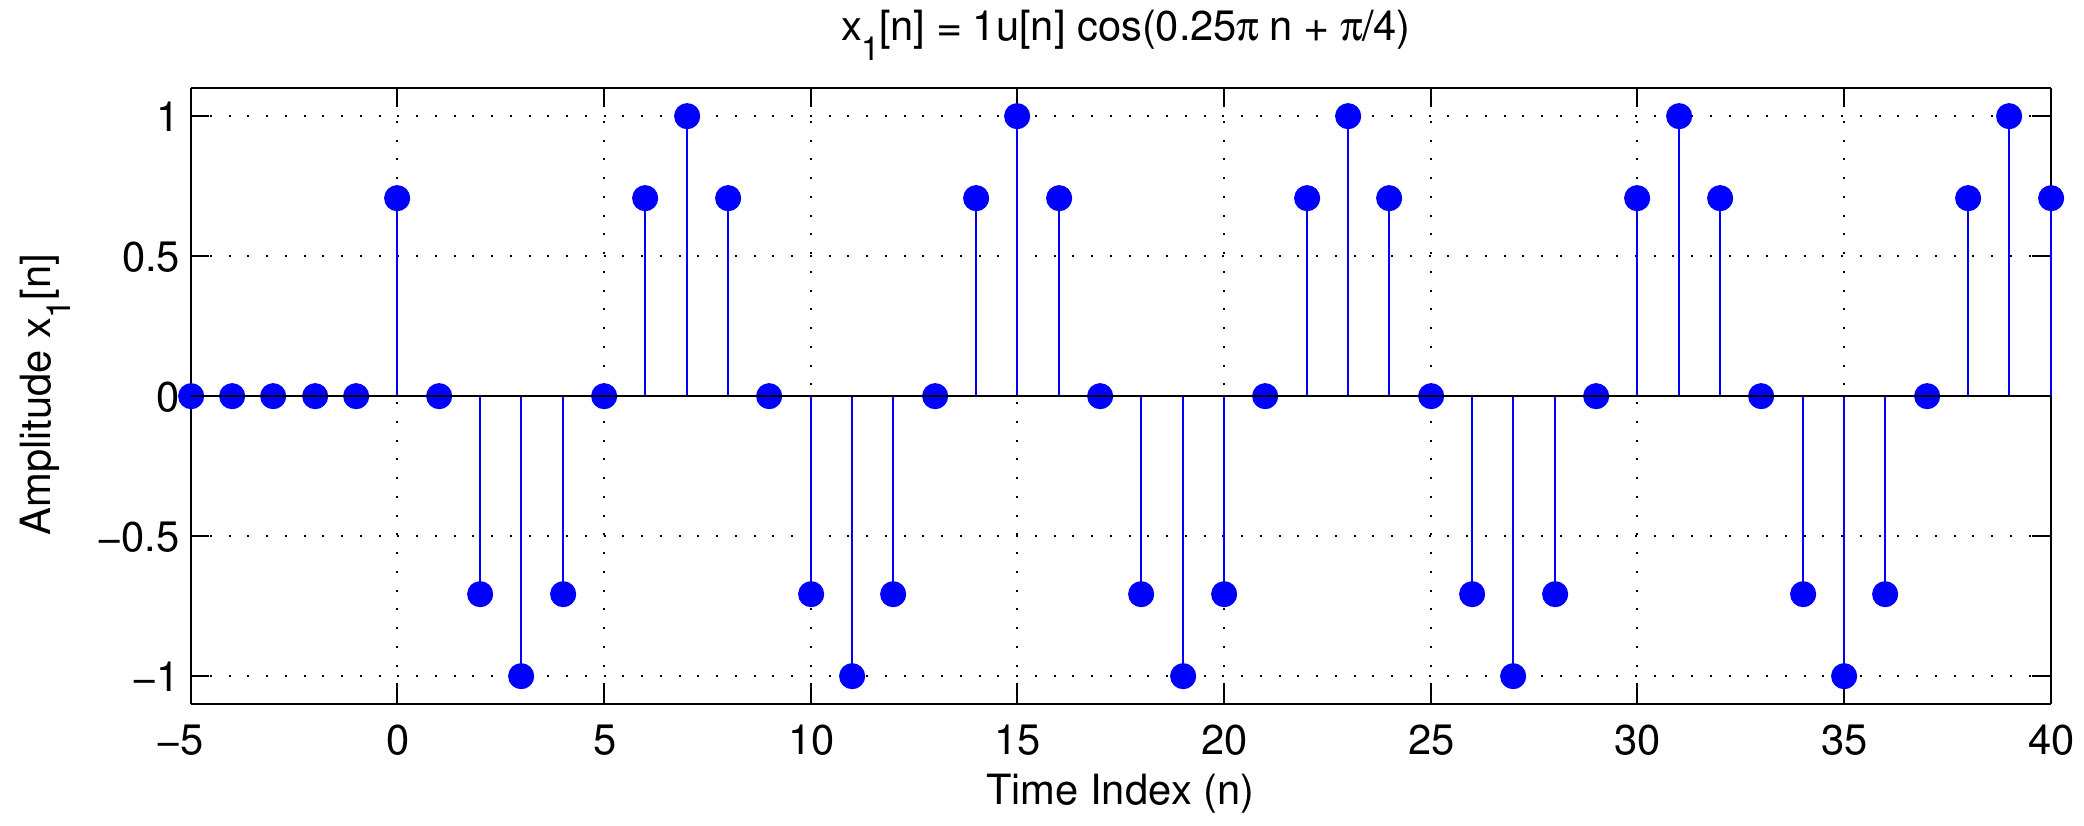
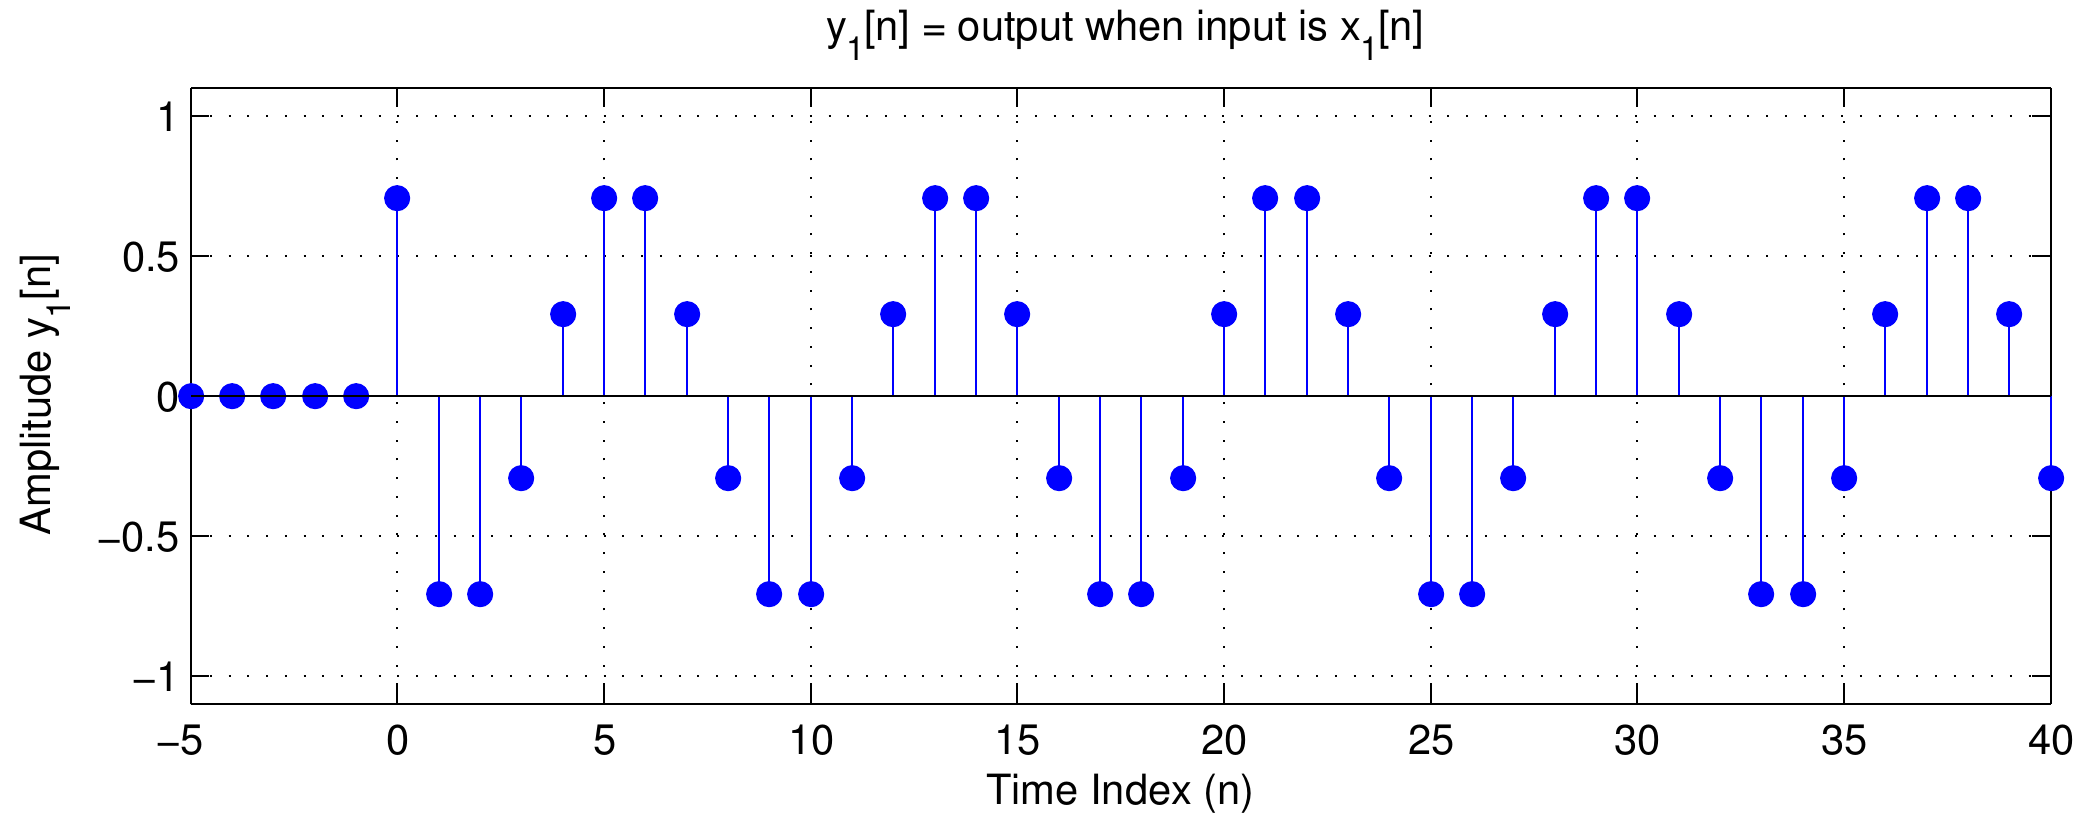
| Figure 1: Comparison of input and output waveforms for the first difference filter. Click on either waveform to hear how it sounds. Assuming the A/D and D/A converters use a sampling rate of 8000 Hz. what frequency do you expect the tones to have? |
| While the frequency of the output tone remains unchanged, it has been modified by a complex scale factor. In order to determine this scale factor, the frequency response of the first difference filter must be evaluated at the frequency of interest: |
|
\(H(\hat\omega)|_{\hat\omega=0.125\pi}=1-e^{-j\hat\omega}|_{\hat\omega=0.125\pi} = 0.3902 e^{j0.4375\pi}\)
Therefore, \(y_1=\mathfrak Re\{0.3902 e^{j0.4375\pi} 2e^{j0.125\pi n + \pi/3}\} = 0.7804 cos(0.125\pi n + 0.7708\pi)\) |
 DSP First 2e
McClellan, Schafer, Yoder
ISBN-10: 0136019250 • ISBN-13: 9780136019251
© 2016 Pearson Education, Inc.