|
|
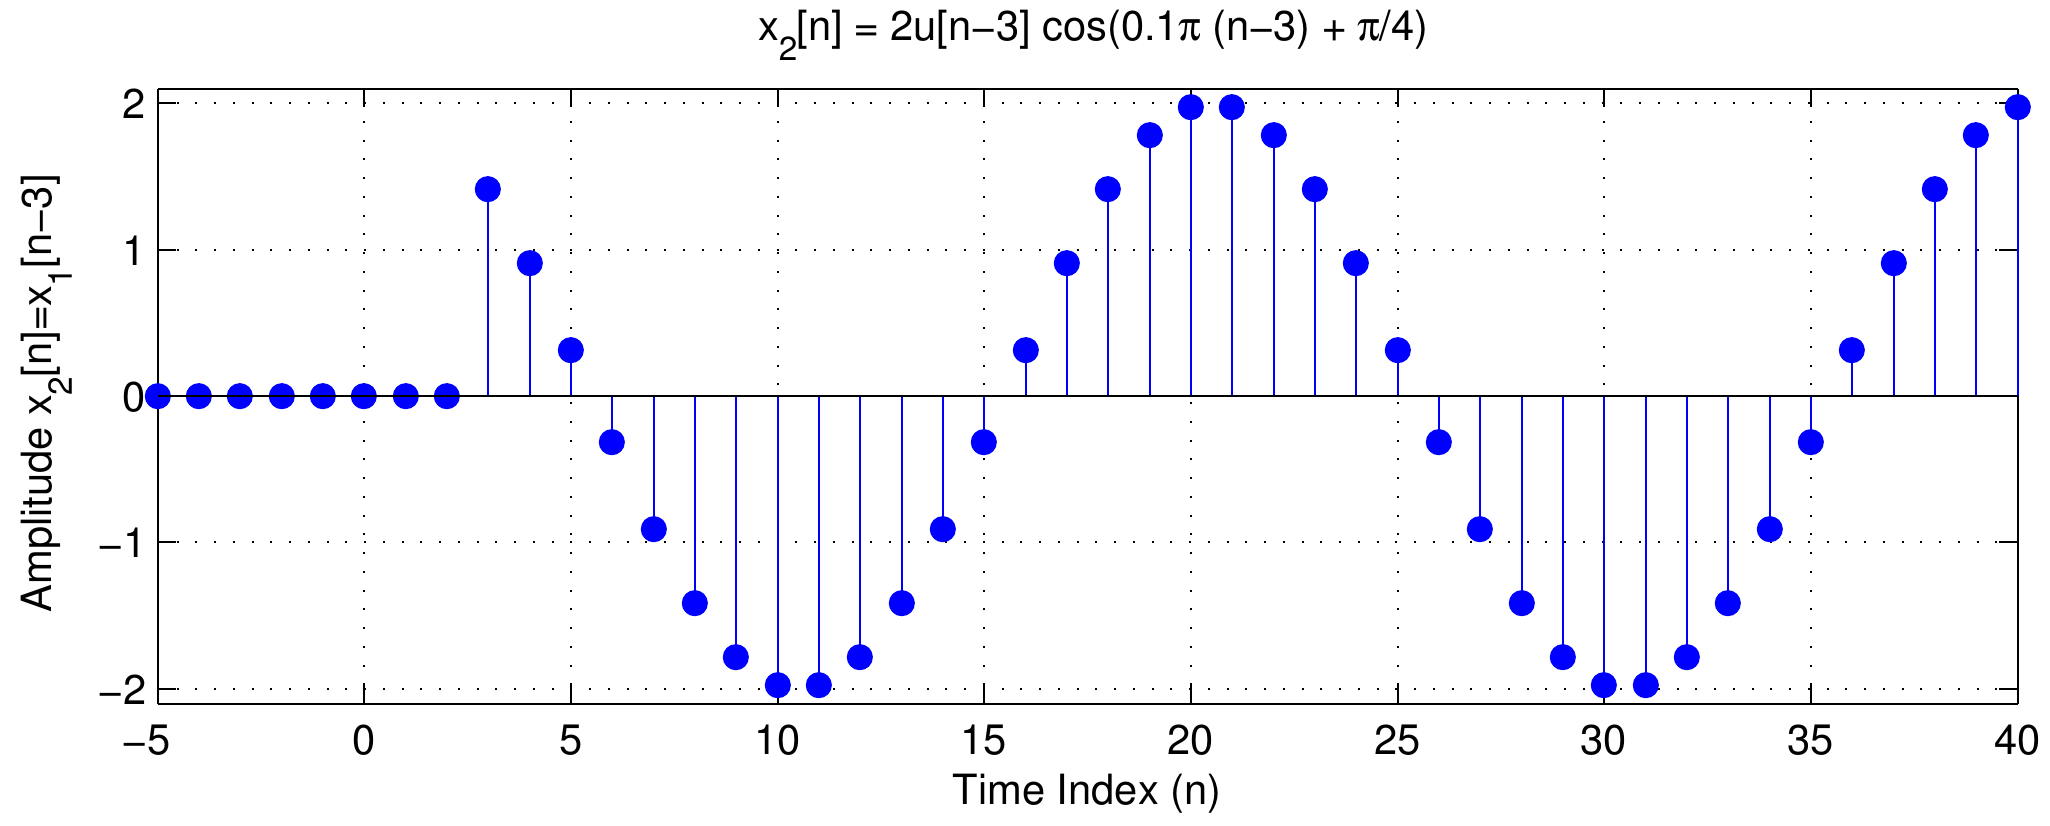
| Figure 1: Comparison of input and output waveform for the 5pt averager filter. Click on either waveform to hear how it sounds. Assuming the A/D and D/A converters use a sampling rate of 8000 Hz. what frequency do you expect the tone to have? |
|
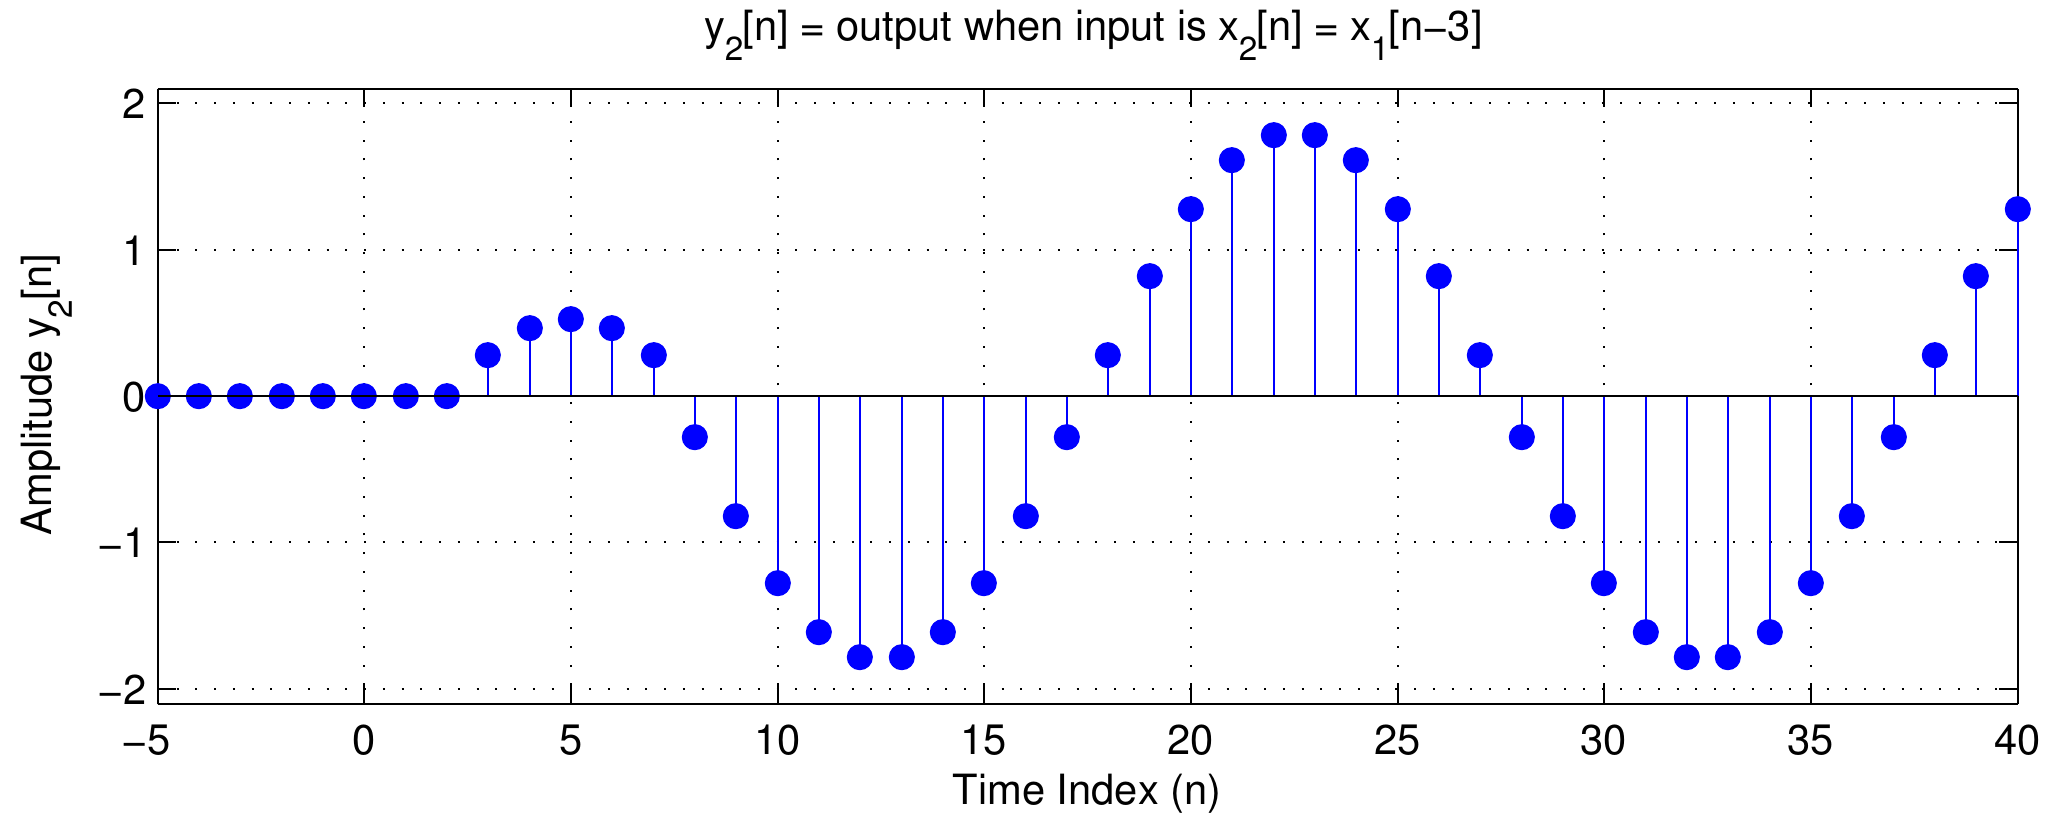
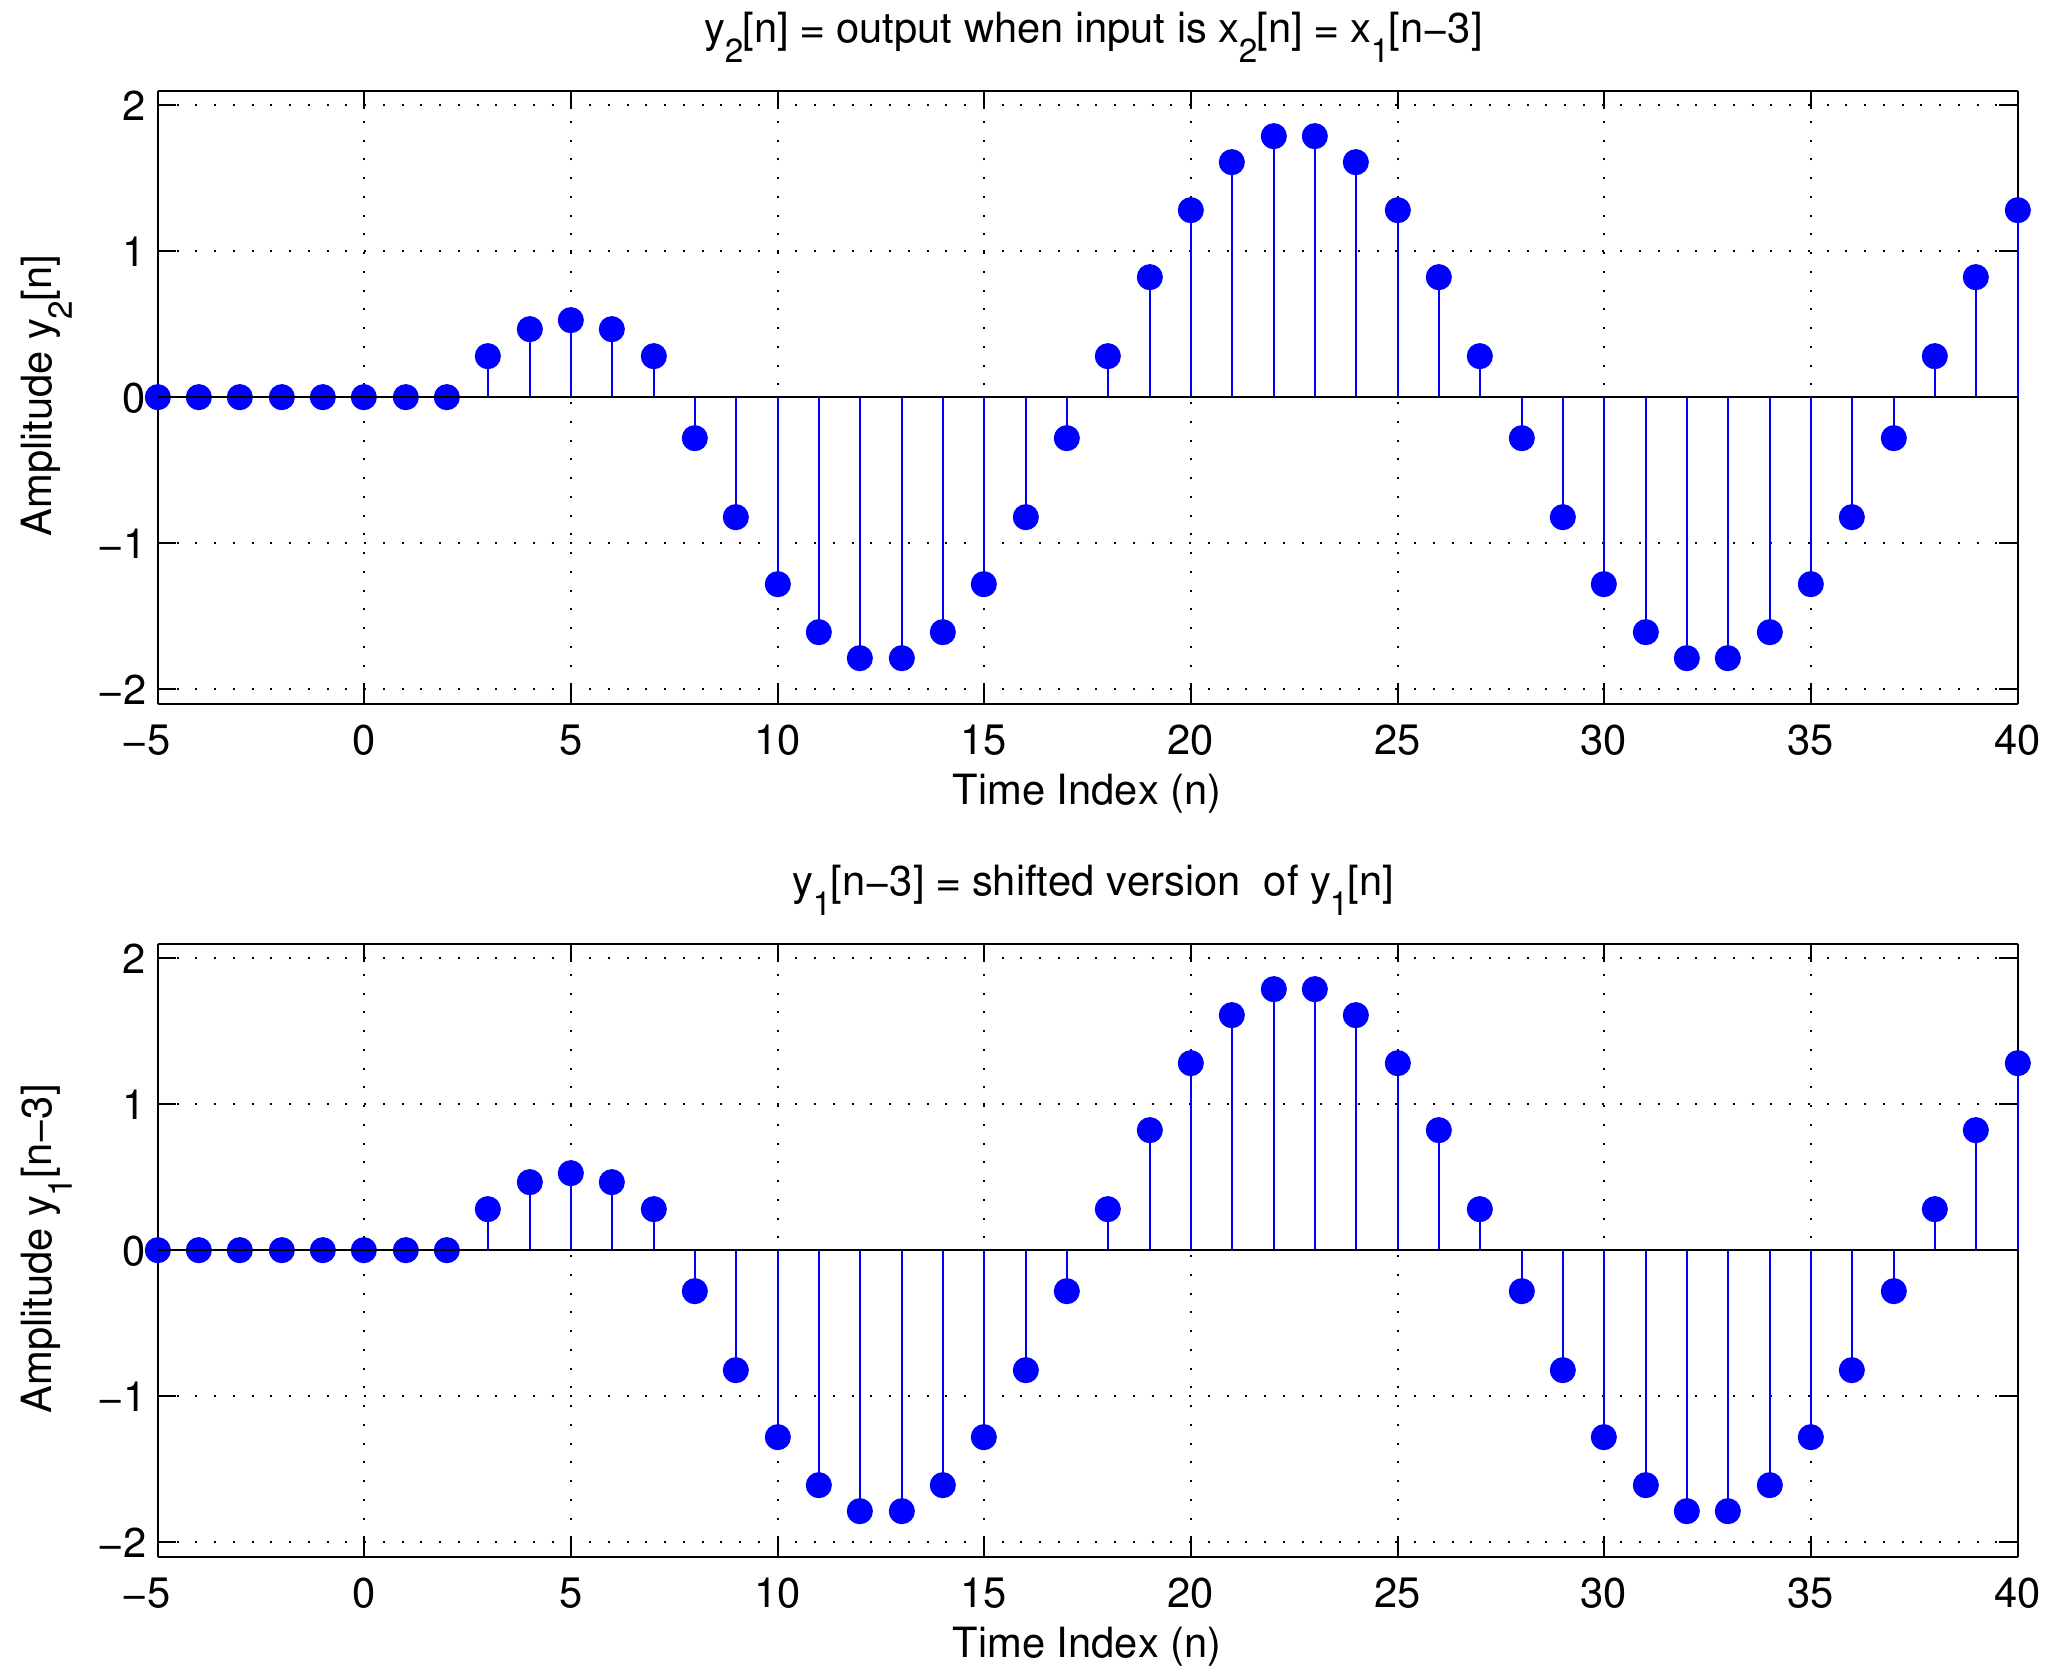
| Figure 2: The top panel is a the filter output for waveform number one delayed by 3 samples. The bottom panel is the filter output for waveform number two. Note that the waveforms are identical thus illustrating the time invariance of the 5pt averager filter. Click on either waveform to hear how it sounds. Assuming the A/D and D/A converters use a sampling rate of 8000 Hz. what frequencies do you expect the outputs to have? |
 DSP First 2e
McClellan, Schafer, Yoder
ISBN-10: 0136019250 • ISBN-13: 9780136019251
© 2016 Pearson Education, Inc.