8. Discrete Fourier Transform Demos - MATLAB 1
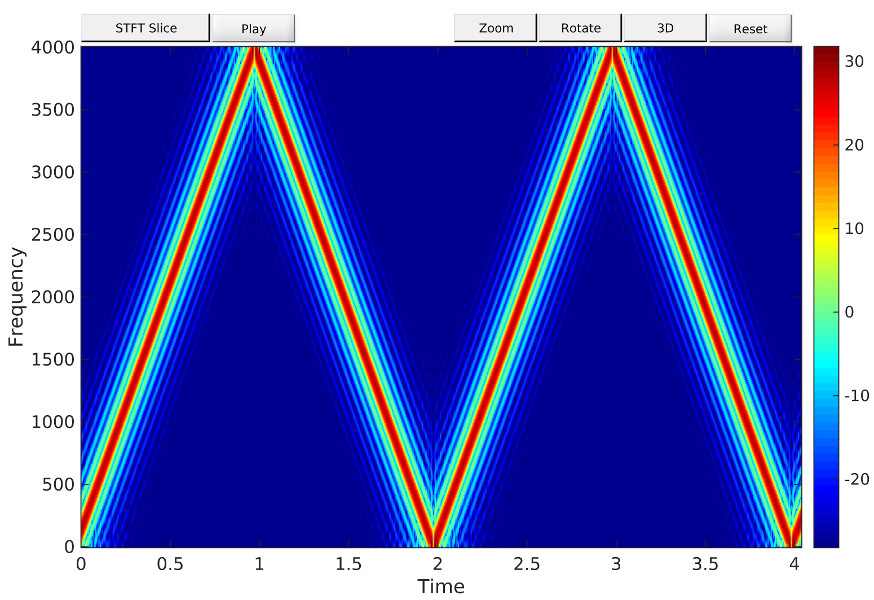
specgramdemo provides interactive control of the important parameters that define a spectrogram.
Features:
- Change window length and window type
- Change window overlap
- Change FFT length (zero padding)
- Show 1-D slice of spectrogram
- Plot options: zooming, 30, 40, 50 and 60 dB magnitude ranges, four color maps
- Three signal types: Sum of sinusoids, Linear chirp, Recorded signal, e.g., speech
 DSP First 2e
McClellan, Schafer, Yoder
ISBN-10: 0136019250 • ISBN-13: 9780136019251
© 2016 Pearson Education, Inc.