Beat Notes and beatcon.m
An interesting situation occurs when we have two sinusoidal
signals of slightly different frequencies; i.e.,
$$
x(t) = A\cos(2\pi(f_c-\Delta f)t)+B\cos(2\pi(f_c+\Delta f)t)
$$
When \(A=B\) the signal can be written as a product:
$$
x(t) = 2A\cos(2\pi(f_c)t) \cos(2\pi(\Delta f)t)
$$
and the resulting signal is called a beat note signal.
With the Beatcon Demo you are able to generate \(x(t)\) for various values
of \(f_c\), \(\Delta f\), \(A\) and \(B\).
Here are three sounds to study. First listen to each of them without knowing what they are.
Can you distinguish two signal components? A high(er) frequency sinusoid and a slowly changing one which might sound like the signal is fading in and out.
beatcon.m is in the DSP Toolbox.
See Getting Started for details on downloading the DSP Toolbox and installing it.
Once the DSP Toolbox is installed correctly beatcon should be on the matlabpath.

-
Invoke the demo/tool by typing
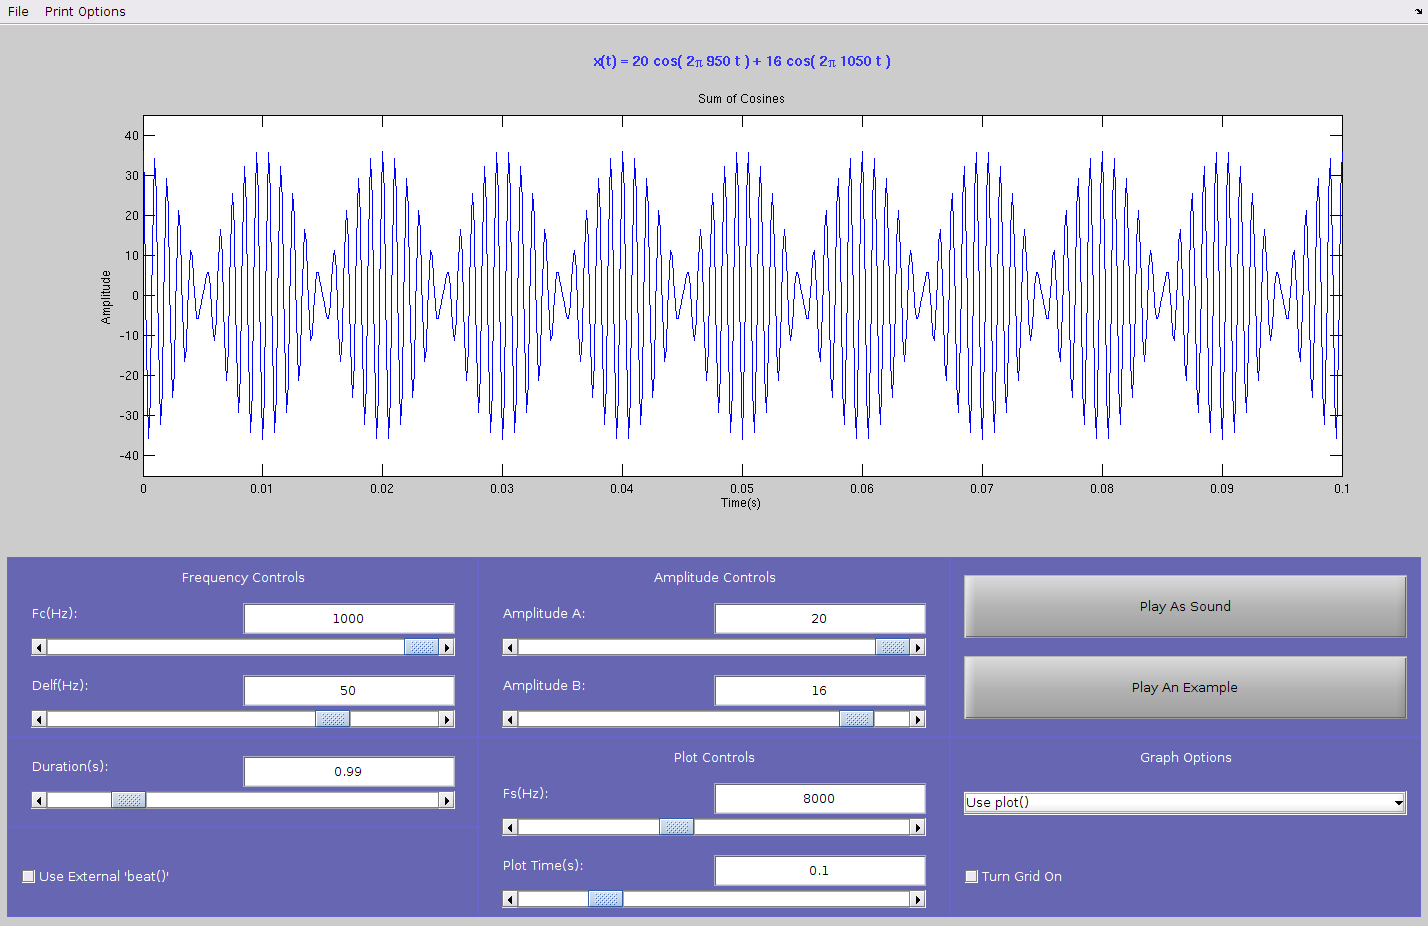
beatconat the Matlab prompt. A small control panel will appear on the screen with buttons and sliders that vary the different parameters for thebeatfunction (see the figure above with a screen shot ofbeatcon). Experiment with thebeatconcontrol panel and use it to complete the following steps. -
Generate a signal in the
beatconGUI with the parameters:A=10,B=10,fc=1000,delf=10,fs=8000, anddur=1secs. Plot the first 0.2 seconds of the resulting signal. Describe the waveform and look for periodic structure(s) in the plot. It should be possible to measure two periods: the period of the "envelope" and the period of the high frequency signal underneath the envelope. -
For this part, try
delfwith different three values: 10, 4, 1 Hz. Send the resulting signals to the D-to-A converter and listen to the sounds (there is a button onbeatconthat will do this for you automatically). Observe the nature of the sound based on the waveform plotted in part (b) and on the theory developed in the textbook. -
Experiment with different values of the center frequency
fcanddelfin an attempt to recreate the mystery sounds given above.
Hint: two of the center frequencies are approximately 440 and 850 Hz.
