8. Discrete Fourier Transform
Overview: This chapter builds on the definition and discussion of the DTFT. The
objective here is to define a numerical Fourier transform called the discrete Fourier
transform (or DFT) that results from taking frequency samples of the DTFT.
We show
how the DFT can be used to compute a spectrum representation of any finite-length
sampled signal very efficiently with the fast Fourier transform (FFT) algorithm. The DFT
not only gives a spectrum representation of any finite-length sequence, but it can also
be used as a representation of a periodic sequence formed by infinite repetition of one
(finite-length) period. Finally, the DFT is the core computation needed in the spectrogram
which provides a time-frequency spectrum analysis of a very long signal by doing DFTs
of successive short sections extracted from the long signal.
Demos - MATLAB 1
specgramdemo provides interactive control of the important parameters that define a spectrogram.
Features:
- Change window length and window type
- Change window overlap
- Change FFT length (zero padding)
- Show 1-D slice of spectrogram
- Plot options: zooming, 30, 40, 50 and 60 dB magnitude ranges, four color maps
- Three signal types: Sum of sinusoids, Linear chirp, Recorded signal, e.g., speech
Labs - MATLAB 2
The objective of this lab is to introduce more complicated signals that are related to the basic sinusoid.
These signals which implement frequency modulation (FM) and amplitude modulation (AM) are widely used in
communication systems such as radio and television. In addition, they can be used to create interesting
sounds that mimic musical instruments. The resulting signal
can be analyzed to show its time-frequency behavior by using the spectrogram.
This lab studies signal synthesis for AM and FM signals, and their time-frequency content as shown in
a spectrogram. An underlying objective of the lab is to learn more about the spectrogram.
The objective of this lab is to study further the spectral content of signals analyzed via the spectrogram.
There are several specific steps that will be considered in this lab:
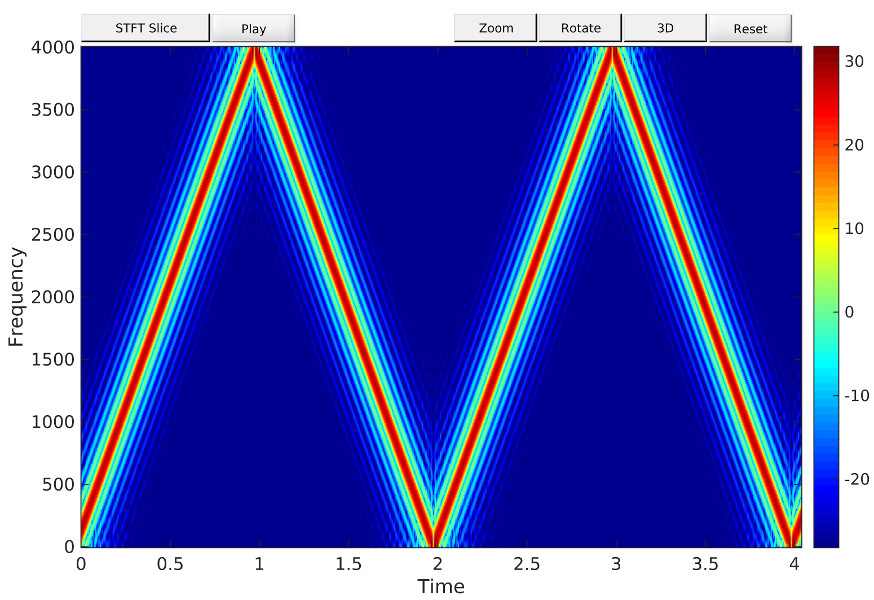
- Synthesize a linear-FM chirp with a MATLAB M-file, and display its spectrogram. Choose the chrip parameters so that aliasing will happen.
- Synthesize a periodic triangle wave with a MATLAB M-file, and display its spectrogram. Relate the harmonic line spectrum to the fundamental period of the triangle wave.
- Compare spectrograms using different scales for amplitude: decibels (dB) for amplitude versus linear amplitude.
- Examine details of the harmonic lines in the dB spectrogram of the triangle wave.
- Spectrogram: make a spectrogram of your voice signal, and relate the harmonic line spectrum to your previous measurement of pitch period.
 DSP First 2e
McClellan, Schafer, Yoder
ISBN-10: 0136019250 • ISBN-13: 9780136019251
© 2016 Pearson Education, Inc.