Overview: In chapter four, the conversion of signals between the
analog and digital domains is studied. The basic ideas underlying
sampling and signal reconstruction are presented. When sampling to convert
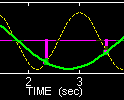
a continuous-time (or analog) signal to a digital form for computer processing and storage, the primary issue is aliasing and the sampling strategy necessary to
avoid aliasing of frequency components. The main objective of our presentation is an
understanding of the Sampling Theorem which states
that the sampling rate must be greater than twice the highest frequency
contained in the analog signal. Frequency content is taken to mean
the spectral content of a signal when represented as a sum of sinusoids.
The signal reconstruction of a D-to-A converter is presentated from a practical point of view as a generalization of interpolation.
The signal reconstruction of a D-to-A converter is presentated from a practical point of view as a generalization of interpolation.
Demos - MATLAB 6
By visualizing the spectrogram of a synthesized chirp and listening to the sound,
we experience the fact that a D-to-C converter cannot create output signals
with frequencies higher than one half of the sampling frequency.
The Continuous-Discrete Sampling Demo (con2dis)
is a program that shows the continuous
and discrete spectra (and signals) during sampling.
Features:
Features:
- Users can change the input frequency and sampling rate.
- Frequency axis can be labeled in hertz or radians/sec.
- Reconstruction through D/A is also shown.
Demos - LabVIEW 1
The Continuous-Discrete Sampling Demo is a program that shows the continuous
and discrete spectra (and signals) during sampling.
Labs - MATLAB 2
The objective in this lab is to introduce digital images as a
second useful signal type. We will show how the
A-to-D sampling and the D-to-A reconstruction processes are
carried out for digital images. In particular,
we will show a commonly used method of image zooming
(reconstruction) that gives poor results a later
lab will revisit this issue and do a better job.
[Files]
The objective of this lab is to study further the spectral content of signals analyzed via the spectrogram.
There are several specific steps that will be considered in this lab:
- Synthesize a linear-FM chirp with a Matlab M-file, and display its spectrogram. Choose the chirp parameters so that aliasing will happen.
- Synthesize a periodic triangle wave with a Matlab M-file, and display its spectrogram. Relate the harmonic line spectrum to the fundamental period of the triangle wave.
- Compare spectrograms using different scales for amplitude: decibels (dB) for amplitude versus linear amplitude.
- Examine details of the harmonic lines in the dB spectrogram of the triangle wave.
- Spectrogram: make a spectrogram of your voice signal, and relate the harmonic line spectrum to your previous measurement of pitch period.
Labs - LabVIEW 1
The objective in this lab is to introduce digital images as a
second useful signal type. We will show how the
A-to-D sampling and the D-to-A reconstruction processes are
carried out for digital images. In particular,
we will show a commonly used method of image zooming
(reconstruction) that gives poor results a later
lab will revisit this issue and do a better job.
[Files]


