
Demos - MATLAB
 1. Introduction
 2. Sinusoids
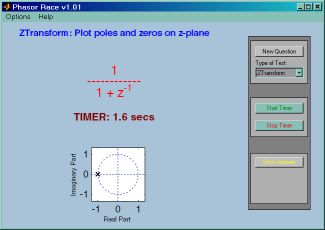
PhasorRaces began as a speed drill for testing complex addition.
Now it includes many other related operations that can be tested
in a "drill" scenario: adding sinusoids, z-transforms, etc.
A timer starts as soon as the problem is posed, so that a
student can try to solve questions quickly and accurately.


 3. Spectrum Representation
This demo shows the interesting situation that occurs when we have two sinusoidal signals of slightly different frequencies.

This MATLAB demo reconstructs a square, triangle, or
sawtooth waveform, using a given number of Fourier Series coefficients.


This demonstrates the idea of harmonic sinusoids.
Five sinusoids with a common fundamental frequency are
added together, one at a time.
 4. Sampling and Aliasing

By visualizing the spectrogram of a synthesized chirp and listening to the sound,
we experience the fact that a D-to-C converter cannot create output signals
with frequencies higher than one half of the sampling frequency.
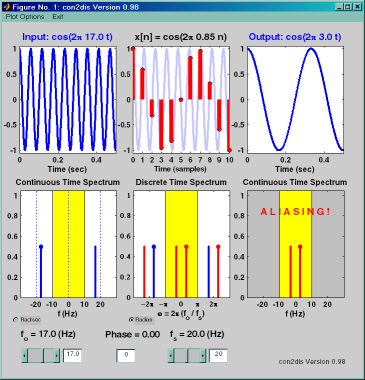
The Continuous-Discrete Sampling Demo (con2dis)
is a program that shows the continuous
and discrete spectra (and signals) during sampling.
Features:
Features:
- Users can change the input frequency and sampling rate.
- Frequency axis can be labeled in hertz or radians/sec.
- Reconstruction through D/A is also shown.


 5. FIR Filters
The Discrete Convolution Demo (dconvdemo) is a program that
helps visualize the process of discrete-time convolution.
Features:
Features:
- Users can choose from a variety of different signals.
- Signals can be dragged around with the mouse with results displayed in real-time.
- Tutorial mode lets students hide convolution result until requested.
- Various plot options enable the tool to be effectively used as a lecture aid in a classroom environment.


 6. Frequency Response of FIR Filters
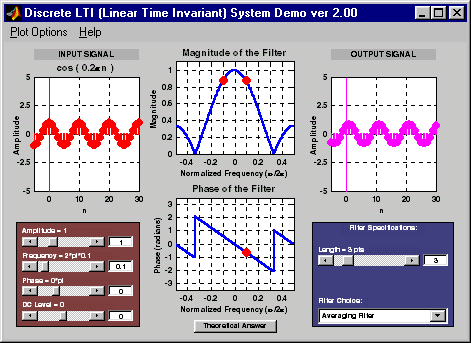
DLTIDemo is a program that illustrates the relationship between the input
and output of a discrete-time linear time-invariant (LTI) filter
when the input is a sinusoidal function.
The user is allowed to control the parameters of both the input sinusoid and the digital filter.


A table of DTFT pairs is usually given as a list of formulas for the signal
\(x[n]\) and its DTFT \(X(e^{j \hat\omega})\). These formulas
can be visualized as plots, and this demo focuses on the ability to recognize
signals and transforms in a graphical form.

The Filter Design Demo is a program that designs simple FIR (and IIR) digital filters,
along with tutorial visualizations of the filter design process.
Features:
- FIR Design with many different window types
- Numerous plot options: magnitude/phase response, pole-zero diagram, and impulse response
- IIR Design of Butterworth filters
- Parks-McClellan FIR Design showing the iterations of the Remez Exchange method
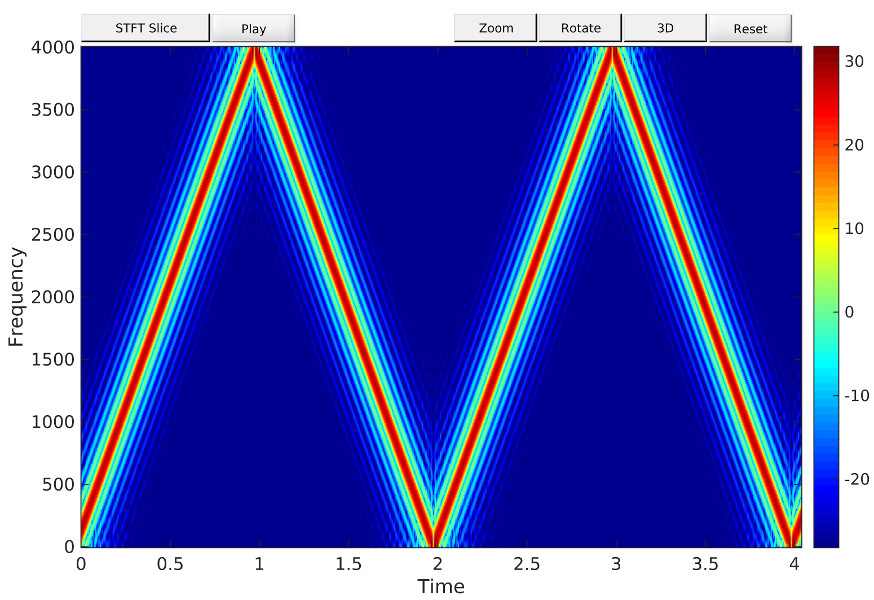
specgramdemo provides interactive control of the important parameters that define a spectrogram.
Features:
- Change window length and window type
- Change window overlap
- Change FFT length (zero padding)
- Show 1-D slice of spectrogram
- Plot options: zooming, 30, 40, 50 and 60 dB magnitude ranges, four color maps
- Three signal types: Sum of sinusoids, Linear chirp, Recorded signal, e.g., speech
 9. z-Transforms
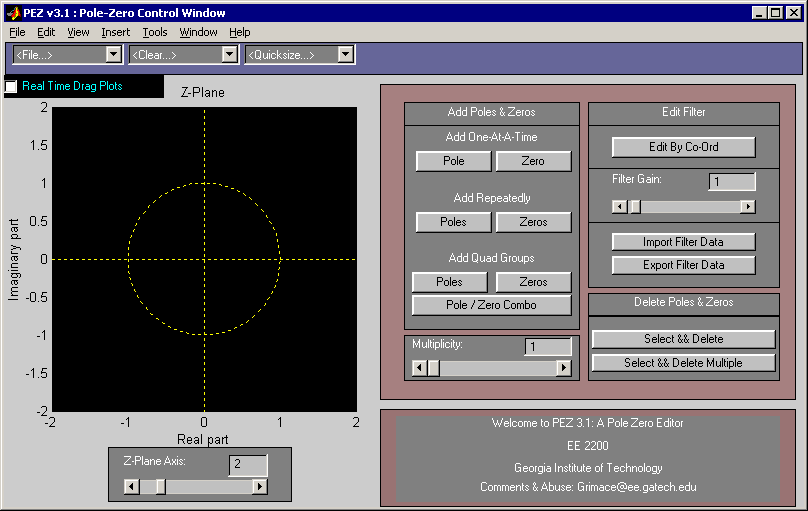
PeZ (pezdemo) is a MATLAB tool for pole/zero manipulation.
Poles and zeros can be placed anywhere on a map of the
\(z\)-plane.
The corresponding time domain (\(n\)) and frequency
domain (\(\hat\omega\)) plots will be displayed.
When a zero pair (or pole pair) is dragged, the
impulse response and frequency response plots will
be updated in real time.
 10. IIR Filters
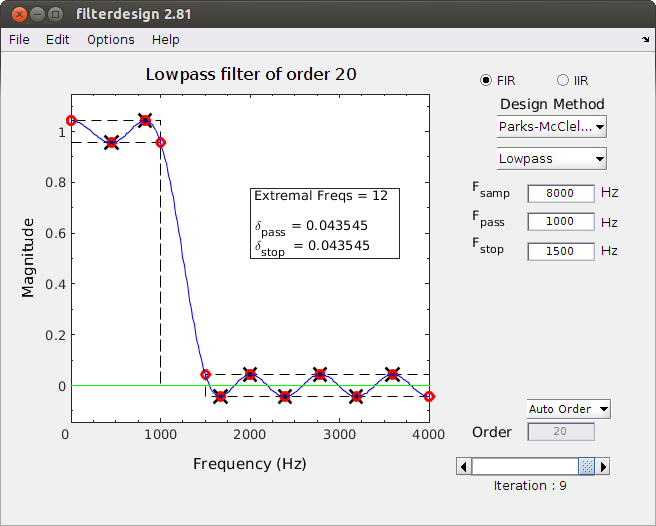
The Filter Design Demo is a program that designs simple IIR (and FIR) digital filters,
along with tutorial visualizations of the filter design process.
Features:
- IIR Design of Butterworth filters
- Numerous plot options: magnitude/phase response, pole-zero diagram, and impulse response
- FIR Design with many different window types
- Parks-McClellan FIR Design showing the iterations of the Remez Exchange method


PeZ (pezdemo) is a MATLAB tool for pole/zero manipulation.
Poles and zeros can be placed anywhere on a map of the
\(z\)-plane.
The corresponding time domain (\(n\)) and frequency
domain (\(\hat\omega\)) plots will be displayed.
When a zero pair (or pole pair) is dragged, the
impulse response and frequency response plots will
be updated in real time.

 A. Complex Numbers

PhasorRaces began as a speed drill for testing complex addition.
Now it includes many other related operations that can be tested
in a "drill" scenario: adding sinusoids, z-transforms, etc.
A timer starts as soon as the problem is posed, so that a
student can try to solve questions quickly and accurately.
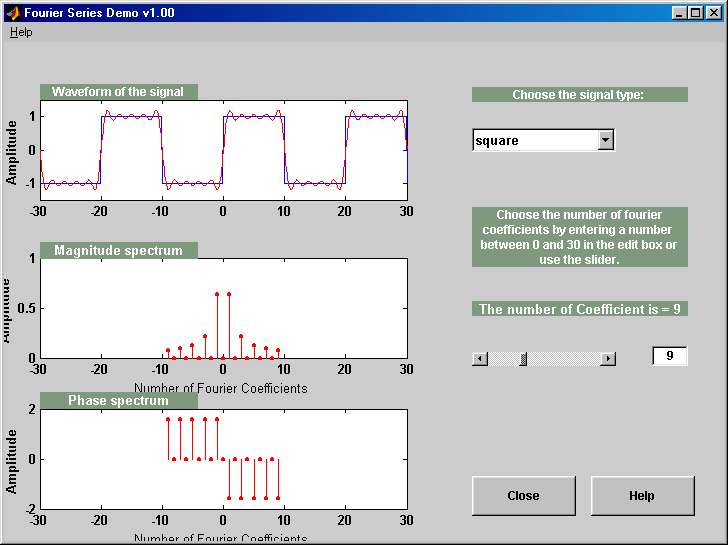
This MATLAB demo reconstructs a square, triangle, or
sawtooth waveform, using a given number of Fourier Series coefficients.
 DSP First 2e
McClellan, Schafer, Yoder
ISBN-10: 0136019250 • ISBN-13: 9780136019251
© 2016 Pearson Education, Inc.